📊 Technical Overview:
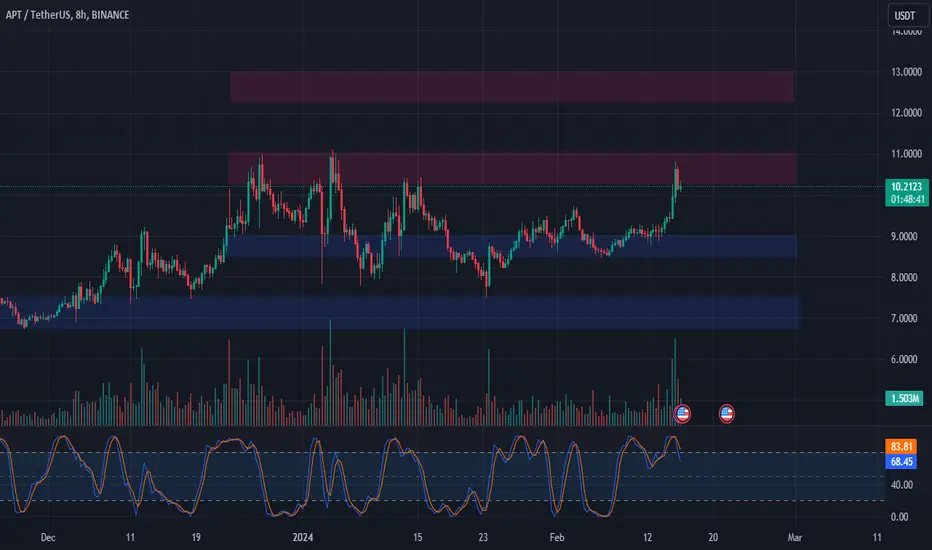
APT: Testing resistance at $10.30 - $11.00.
Key Levels: $10.30, $11.00, $9.00, $12.30, $13.00.
📉📈 Trade Analysis:
Resistance Test: APT testing the resistance area.
Overbought: Overbought on the 8-hour chart.
Support Levels: Potential support at $9.00.
Long Trade Plan: Consider entering a long trade if $9.00 holds.
Profit Targets: $10.30 - $11.00, $12.30 - $13.00.
Potential Gain: Roughly a 45% gain from $9.00 to $13.00.
Stop Loss: Below $8.50.
🚀🔄 Note: Monitor price action around $9.00 and adjust trade strategy accordingly. 📊💡 #APT #TradeAnalysis #StockMarket 📈📉
כתב ויתור
המידע והפרסומים אינם אמורים להיות, ואינם מהווים, עצות פיננסיות, השקעות, מסחר או סוגים אחרים של עצות או המלצות שסופקו או מאושרים על ידי TradingView. קרא עוד בתנאים וההגבלות.
כתב ויתור
המידע והפרסומים אינם אמורים להיות, ואינם מהווים, עצות פיננסיות, השקעות, מסחר או סוגים אחרים של עצות או המלצות שסופקו או מאושרים על ידי TradingView. קרא עוד בתנאים וההגבלות.