And it didn't, again. Like 10 times already did AASTER get rejected in the exact same RESISTANCE ZONE I've had marked on my charts.
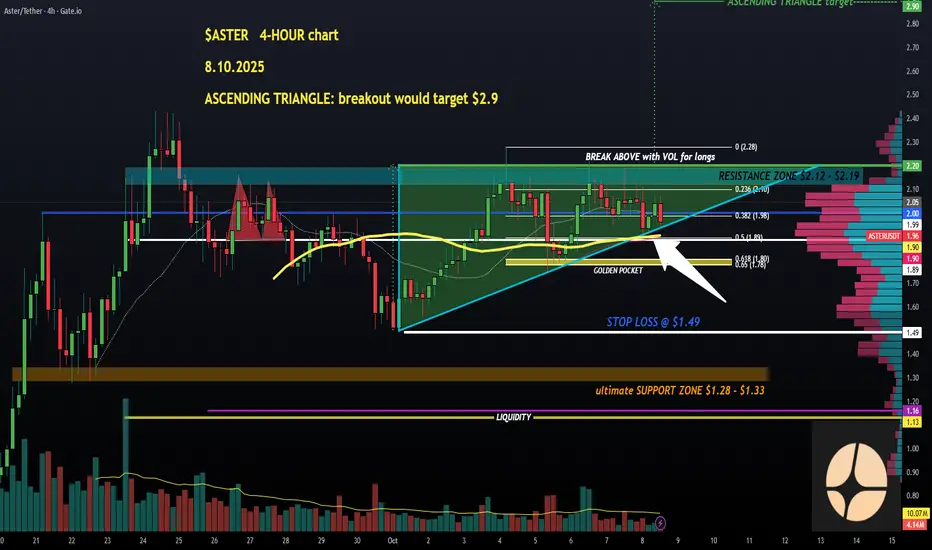
Two weeks of rejections. My LONG position opened last weekend ($1.77) is still super safe, though. Lots of different kinds of support to keep me calm, the STOP LOSS at $1.49 stays there until #AsterDEX closes a strong candle above $2.2.
The 4-HOUR chart has now got a nicely formed (bullish) ASCENDING TRIANGLE with a breakout point at.. you guessed - $2.2.
Super bullish if it does that. The BREAKOUT target at $2.9. And that's where I fully exit the LONG.
Buying more spot once the BREAKOUT is in, and not selling that any time soon.
For people who don't have a position yet, or want to make their positions larger, one tip: use the established support levels, such as 50 SMA (think yellow upcurving moving average line), which is actually nicely confluenced with the TRIANGLE'S lower trendline and supported by Fib 0.5.
$1.9 is also where the nearest cluster of LONG liquidations is sitting. Alternatively, use the GOLDEN POCKET as we might get a wick down in case of a flash-crash. And there could be one if the BTC dominance exceeds 59.3% - 59.4%, explained in my previous post today in more detail.
Long-term SUPER bullish, short-term not so much, the consolidation could easily go on for another few days. 👽💙
Two weeks of rejections. My LONG position opened last weekend ($1.77) is still super safe, though. Lots of different kinds of support to keep me calm, the STOP LOSS at $1.49 stays there until #AsterDEX closes a strong candle above $2.2.
The 4-HOUR chart has now got a nicely formed (bullish) ASCENDING TRIANGLE with a breakout point at.. you guessed - $2.2.
Super bullish if it does that. The BREAKOUT target at $2.9. And that's where I fully exit the LONG.
Buying more spot once the BREAKOUT is in, and not selling that any time soon.
For people who don't have a position yet, or want to make their positions larger, one tip: use the established support levels, such as 50 SMA (think yellow upcurving moving average line), which is actually nicely confluenced with the TRIANGLE'S lower trendline and supported by Fib 0.5.
$1.9 is also where the nearest cluster of LONG liquidations is sitting. Alternatively, use the GOLDEN POCKET as we might get a wick down in case of a flash-crash. And there could be one if the
Long-term SUPER bullish, short-term not so much, the consolidation could easily go on for another few days. 👽💙
כתב ויתור
המידע והפרסומים אינם אמורים להיות, ואינם מהווים, עצות פיננסיות, השקעות, מסחר או סוגים אחרים של עצות או המלצות שסופקו או מאושרים על ידי TradingView. קרא עוד בתנאים וההגבלות.
כתב ויתור
המידע והפרסומים אינם אמורים להיות, ואינם מהווים, עצות פיננסיות, השקעות, מסחר או סוגים אחרים של עצות או המלצות שסופקו או מאושרים על ידי TradingView. קרא עוד בתנאים וההגבלות.