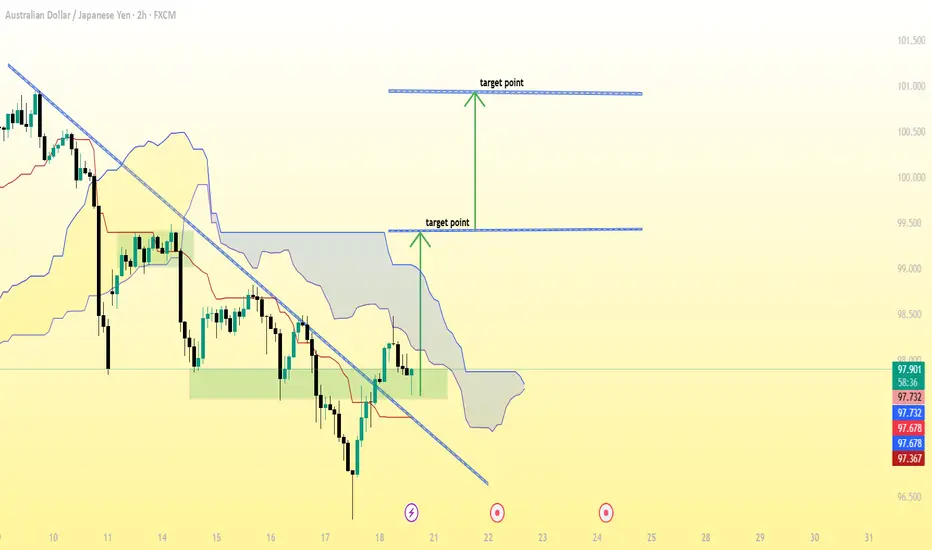
AUD/JPY (2-hour timeframe), here’s a breakdown of what’s visible:
The downtrend line has been broken to the upside, suggesting a potential bullish reversal.
The Ichimoku Cloud shows price moving above or attempting to move above the cloud — another bullish signal.
Two target points are already marked on my chart:
1. First target: around 99.50
2. Second (final) target: around 100.75–101.00
✅ Summary of Target Zones:
🎯 Target 1: ~99.50
🎯 Target 2: ~100.75–101.00
📉 Stop Loss Suggestion:
My might place it just below the recent support or below the cloud (around 97.00–97.20 zone), depending on my risk tolerance.
עסקה פעילה
active activeעסקה סגורה: היעד הושג
1st target done פרסומים קשורים
כתב ויתור
המידע והפרסומים אינם מיועדים להיות, ואינם מהווים, ייעוץ או המלצה פיננסית, השקעתית, מסחרית או מכל סוג אחר המסופקת או מאושרת על ידי TradingView. קרא עוד ב־תנאי השימוש.
פרסומים קשורים
כתב ויתור
המידע והפרסומים אינם מיועדים להיות, ואינם מהווים, ייעוץ או המלצה פיננסית, השקעתית, מסחרית או מכל סוג אחר המסופקת או מאושרת על ידי TradingView. קרא עוד ב־תנאי השימוש.