Key Technical Indicators:
Moving Averages: The stock is trading above its 200-day exponential moving average (EMA), indicating a long-term uptrend.
Stochastic RSI: The stochastic RSI is in the overbought zone, suggesting potential for a short-term pullback.
MACD: The Moving Average Convergence Divergence (MACD) is above the signal line, supporting the current bullish momentum.
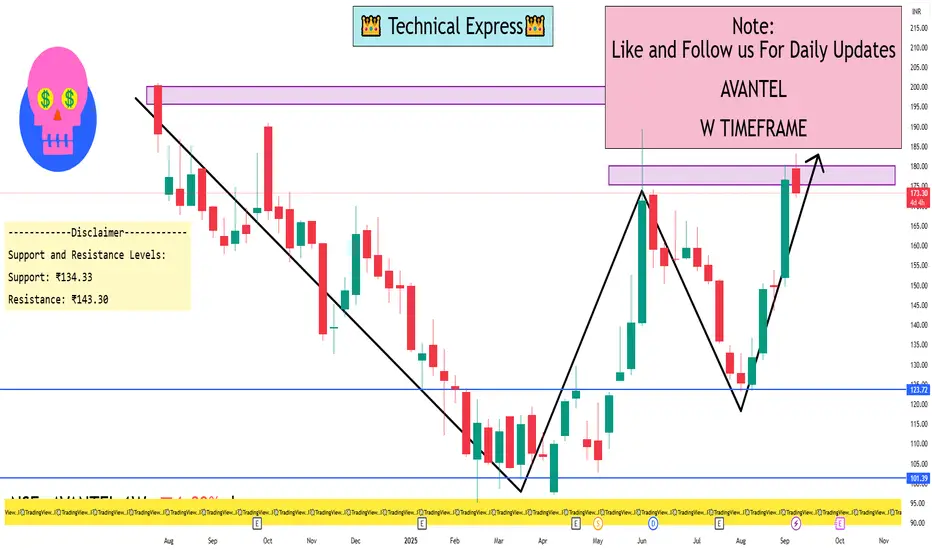
Support and Resistance Levels:
Support: ₹134.33
Resistance: ₹143.30
Moving Averages: The stock is trading above its 200-day exponential moving average (EMA), indicating a long-term uptrend.
Stochastic RSI: The stochastic RSI is in the overbought zone, suggesting potential for a short-term pullback.
MACD: The Moving Average Convergence Divergence (MACD) is above the signal line, supporting the current bullish momentum.
Support and Resistance Levels:
Support: ₹134.33
Resistance: ₹143.30
Hello Guys ..
WhatsApp link- wa.link/d997q0
Email - techncialexpress@gmail.com ...
Script Coder/Trader//Investor from India. Drop a comment or DM if you have any questions! Let’s grow together!
WhatsApp link- wa.link/d997q0
Email - techncialexpress@gmail.com ...
Script Coder/Trader//Investor from India. Drop a comment or DM if you have any questions! Let’s grow together!
פרסומים קשורים
כתב ויתור
המידע והפרסומים אינם אמורים להיות, ואינם מהווים, עצות פיננסיות, השקעות, מסחר או סוגים אחרים של עצות או המלצות שסופקו או מאושרים על ידי TradingView. קרא עוד בתנאים וההגבלות.