Key Observations
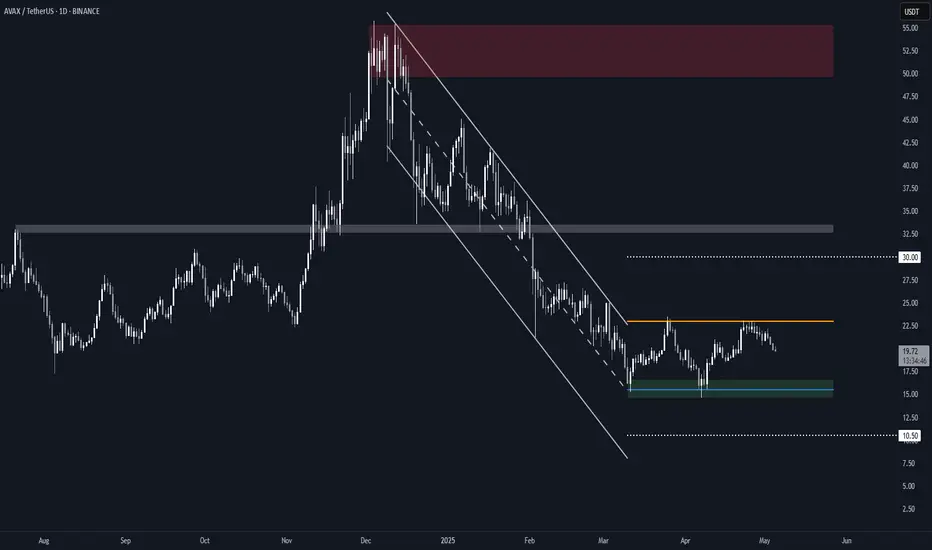
• The current range has two clear touches on both support ($15.50) and resistance ($23.00), forming a valid rectangle structure.
• This follows a sideways channel breakout, suggesting a consolidation phase which is often a precursor to a larger move.
Range Levels
• Resistance – $23.00: Capped price twice in April, marking the upper bound of the rectangle.
• Support – $15.50: Held firmly on two separate pullbacks.
• Midrange Bias – As long as AVAX remains within this box, directional conviction remains limited.
Breakout/Breakdown Scenarios
• Bullish Breakout: If AVAX closes decisively above $23.00, the measured target would be ~$30, based on the rectangle height projected upward (linear scale).
• Bearish Breakdown: If it loses $15.50 support, the downside target becomes $10.50, calculated using the same rectangle height on log scale (to reflect proportional downside risk).
Until either side breaks, this remains a range-trading environment.
כתב ויתור
המידע והפרסומים אינם מיועדים להיות, ואינם מהווים, ייעוץ או המלצה פיננסית, השקעתית, מסחרית או מכל סוג אחר המסופקת או מאושרת על ידי TradingView. קרא עוד ב־תנאי השימוש.
כתב ויתור
המידע והפרסומים אינם מיועדים להיות, ואינם מהווים, ייעוץ או המלצה פיננסית, השקעתית, מסחרית או מכל סוג אחר המסופקת או מאושרת על ידי TradingView. קרא עוד ב־תנאי השימוש.