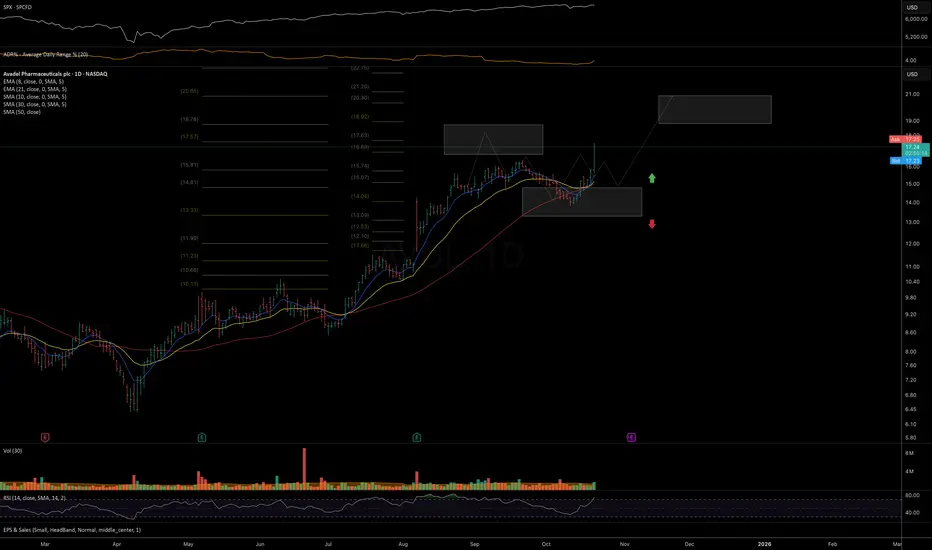
Price continues to follow the trend structure outlined since August and is showing strong follow-through from the mid-term support mentioned last week.
As long as price is holding above the 21 EMA, I’m watching for upside momentum to extend toward the 19–21 macro resistance zone.
Chart:

Previously:
• On upside potential (Oct 14):
Chart:
https://www.tradingview.com/symbols/NASDAQ-AVDL/minds/?mind=GZ4-cgIFSnC5w35engZLZQ
• On mid-term support (Oct 3):
Chart:
https://www.tradingview.com/symbols/NASDAQ-AVDL/minds/?mind=_pT3EX_HSvCwTpIk129wAg
• On resistance and support (Aug 27):
Chart:
https://www.tradingview.com/symbols/NASDAQ-AVDL/minds/?mind=PNLuEMJYRxeVMXY2xw-BqA
As long as price is holding above the 21 EMA, I’m watching for upside momentum to extend toward the 19–21 macro resistance zone.
Chart:
Previously:
• On upside potential (Oct 14):
Chart:
https://www.tradingview.com/symbols/NASDAQ-AVDL/minds/?mind=GZ4-cgIFSnC5w35engZLZQ
• On mid-term support (Oct 3):
Chart:
https://www.tradingview.com/symbols/NASDAQ-AVDL/minds/?mind=_pT3EX_HSvCwTpIk129wAg
• On resistance and support (Aug 27):
Chart:
https://www.tradingview.com/symbols/NASDAQ-AVDL/minds/?mind=PNLuEMJYRxeVMXY2xw-BqA
📊 Daily FREE Market Insights | Crypto + US Stocks
⚡ Technical analysis, setups & commentary
🌍 t.me/MarketArtistryENG | 🇷🇺 t.me/marketartistry
⚡ Technical analysis, setups & commentary
🌍 t.me/MarketArtistryENG | 🇷🇺 t.me/marketartistry
כתב ויתור
המידע והפרסומים אינם מיועדים להיות, ואינם מהווים, ייעוץ או המלצה פיננסית, השקעתית, מסחרית או מכל סוג אחר המסופקת או מאושרת על ידי TradingView. קרא עוד ב־תנאי השימוש.