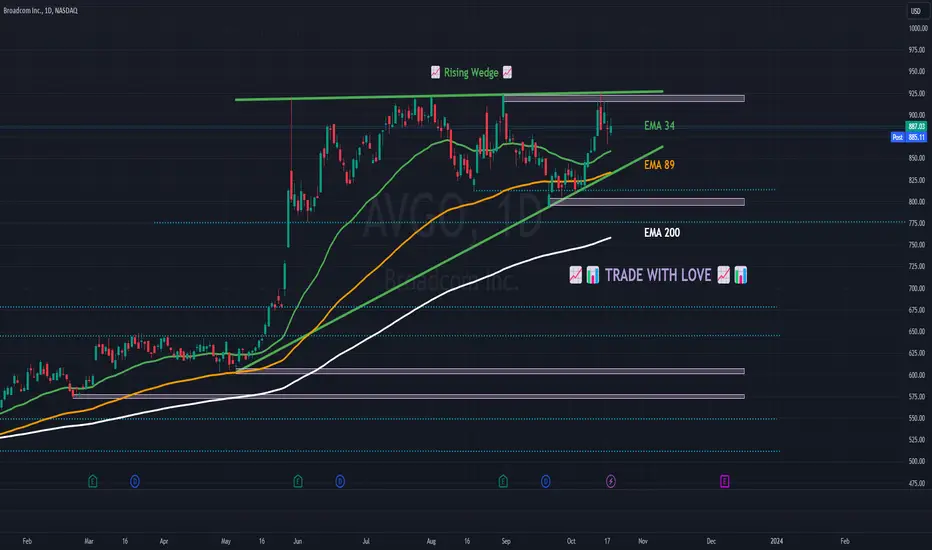
📈 What is a Rising Wedge? The Rising Wedge is a bearish chart pattern characterized by two converging trendlines, with the lower trendline sloping upward more than the upper trendline. It typically signals a potential bearish reversal, with the price likely to break downward after the wedge pattern.
📈 How to Identify:
Draw a trendline connecting at least two lower highs (upper trendline).
Draw another trendline connecting at least two lower lows (lower trendline).
📈 What it Signals: The Rising Wedge suggests a potential bearish reversal, with sellers prevailing at lower highs within the wedge. It often forms during uptrends and can precede a significant price move to the downside.
📈 Trade Strategy:
Consider short-selling or setting stop-loss levels if the price breaks below the lower trendline of the Rising Wedge.
Set profit targets based on the pattern's height subtracted from the breakdown point.
Implement a stop-loss to manage risk in case of a false breakdown.
Remember to use other technical indicators and conduct thorough research to support your analysis before making any trading decisions. Happy charting and trading! 📉💹
כתב ויתור
המידע והפרסומים אינם מיועדים להיות, ואינם מהווים, ייעוץ או המלצה פיננסית, השקעתית, מסחרית או מכל סוג אחר המסופקת או מאושרת על ידי TradingView. קרא עוד ב־תנאי השימוש.
כתב ויתור
המידע והפרסומים אינם מיועדים להיות, ואינם מהווים, ייעוץ או המלצה פיננסית, השקעתית, מסחרית או מכל סוג אחר המסופקת או מאושרת על ידי TradingView. קרא עוד ב־תנאי השימוש.