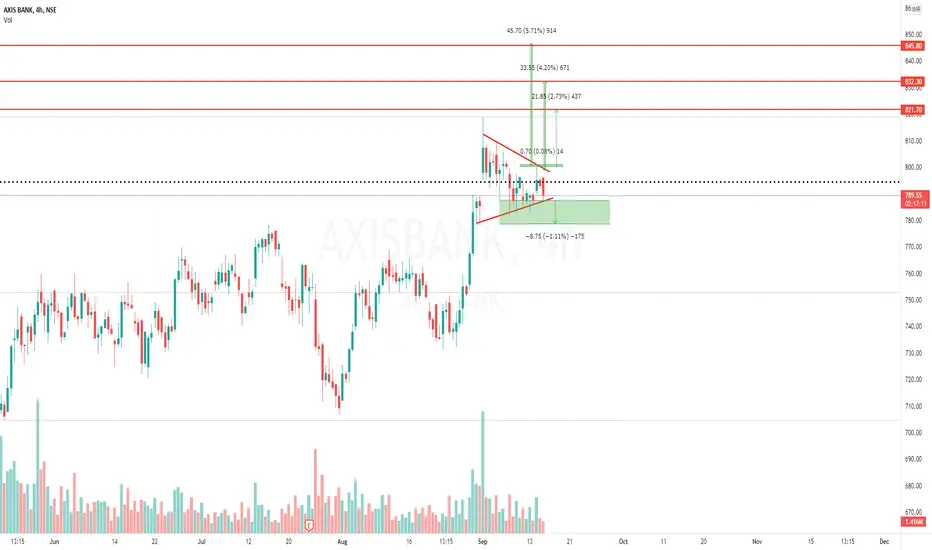
Stock Analysis: AXIS bank has formed the sym triangle pattern, it is good buy around marked demand area with below level as stop loss once it broke the upper level expected to reach the target given on the chart. Let's see.
Happy Investing!
Happy Investing!
עסקה פעילה
Target 1 doneכתב ויתור
The information and publications are not meant to be, and do not constitute, financial, investment, trading, or other types of advice or recommendations supplied or endorsed by TradingView. Read more in the Terms of Use.
כתב ויתור
The information and publications are not meant to be, and do not constitute, financial, investment, trading, or other types of advice or recommendations supplied or endorsed by TradingView. Read more in the Terms of Use.