Long-Term Technical Analysis Summary
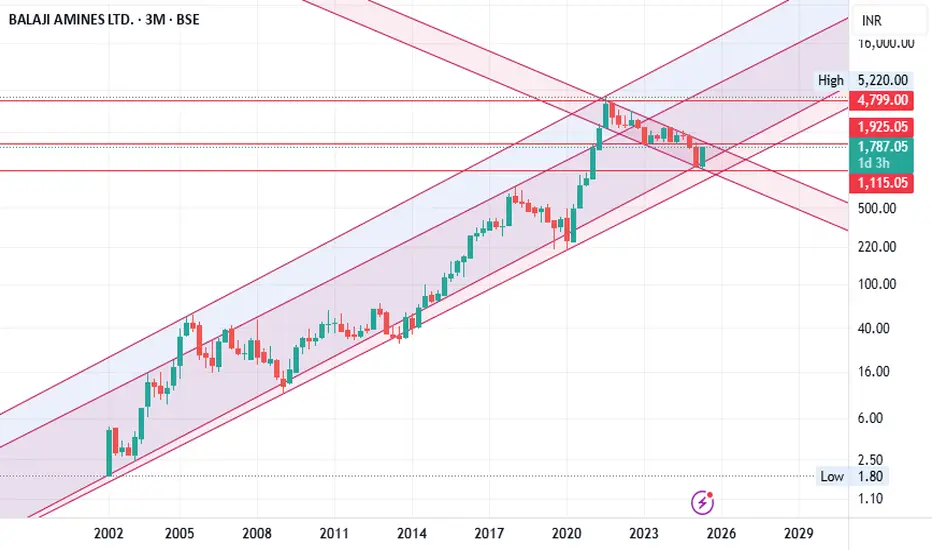
Trend: The price has been moving inside a strong upward-sloping parallel channel for over two decades.
Recent correction: After peaking in 2021, the stock corrected sharply and has now tested the lower boundary of the channel (support zone), bouncing from around ₹1142 to ₹1787 in the current candle. It took 4 years from Jul 2021 to Jan 2025 to reach the bottom from the top. Likewise it took 4 years from July 2005 to Jan 2009 to reach the bottom from the top.
Strong long-term support: Price respected the lower channel support and bounced, indicating bulls are still defending the structure.
🔍 Key Levels
Support Zone:
₹1,115: Major support near the lower channel and trendline confluence.
₹1,420: Previous low and another support level.
Resistance Zone:
₹1,925: Near-term resistance (currently being tested).
₹4,799: Major horizontal resistance.
₹5,220: All-time high and top of the rising channel.
Since price has already bounced strongly from ₹1,142 and broken above short-term downtrend resistance, current levels around ₹1,780–₹1,800 could still be considered an entry with confirmation.
🎯 Targets
Short-term: ₹1,925 (current resistance)
Medium-term: ₹2,800–₹3,200 (midline of the channel)
Long-term: ₹4,800 and ₹5,220+ (previous high and channel top)
🧠 Conclusion & Strategy
The stock is still firmly within a long-term bullish channel.
The recent bounce from channel support marks a potential reversal zone.
If momentum sustains and price breaks above ₹1,925, it confirms a trend continuation toward ₹3,000–₹5,200.
Accumulation at dips near the lower channel or retest zones is ideal for investors with a multi-quarter to multi-year view.
Note: This is for educational purpose only and not a stock recommendation.
כתב ויתור
המידע והפרסומים אינם מיועדים להיות, ואינם מהווים, ייעוץ או המלצה פיננסית, השקעתית, מסחרית או מכל סוג אחר המסופקת או מאושרת על ידי TradingView. קרא עוד ב־תנאי השימוש.
כתב ויתור
המידע והפרסומים אינם מיועדים להיות, ואינם מהווים, ייעוץ או המלצה פיננסית, השקעתית, מסחרית או מכל סוג אחר המסופקת או מאושרת על ידי TradingView. קרא עוד ב־תנאי השימוש.