** Trading opportunity **
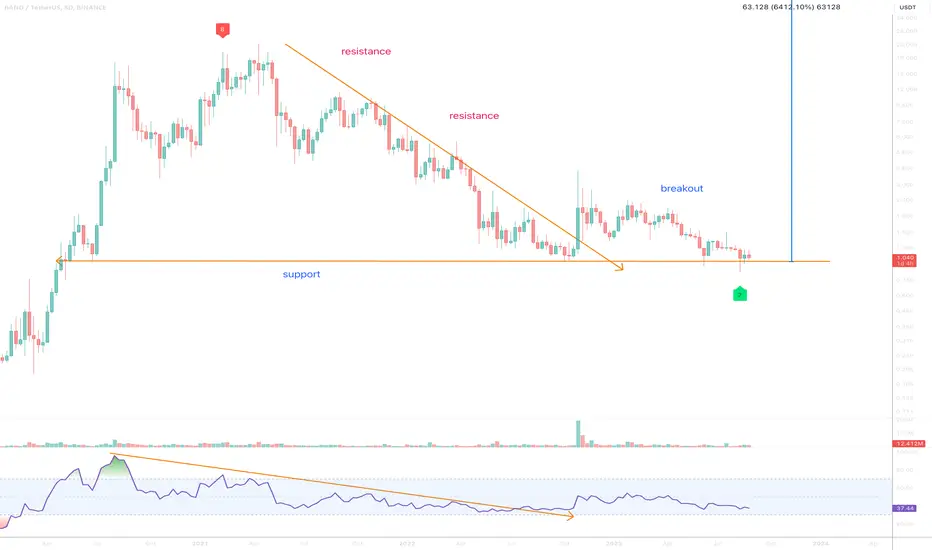
On the above 8-day chart price action has corrected 95% since April 2021. A number of reasons now exist to be long, including:
1) Price action and RSI resistance breakouts.
2) Regular bullish divergence. Seven Oscillators print positive divergence with price action over the last 3 to 4 months.
3) Support and resistance, price is on strong historical support, look left.
Is it possible price action continues to correct? Yes.
Is it probable? No.
Ww
Type: trade
Risk: <= 6%
Timeframe: Act now
Return: 50x
עסקה פעילה
nudge nudge wink winkהערה
on supportעסקה פעילה
A good moment.עסקה פעילה
2-day GRM confirmationהערה
nudge nudgeעסקה פעילה
הפקודה בוטלה
Should the $1 support fail it is straight to 30 cents for the next. Would wait for confirmation of support on the dollar area for a week before adding to existing longs.כתב ויתור
המידע והפרסומים אינם אמורים להיות, ואינם מהווים, עצות פיננסיות, השקעות, מסחר או סוגים אחרים של עצות או המלצות שסופקו או מאושרים על ידי TradingView. קרא עוד בתנאים וההגבלות.
כתב ויתור
המידע והפרסומים אינם אמורים להיות, ואינם מהווים, עצות פיננסיות, השקעות, מסחר או סוגים אחרים של עצות או המלצות שסופקו או מאושרים על ידי TradingView. קרא עוד בתנאים וההגבלות.