📅 BANK NIFTY 15-Min Trading Plan for 6-May-2025
(Gap Opening Consideration: 200+ Points | Price Structure & Level Oriented | Educational Purpose Only)
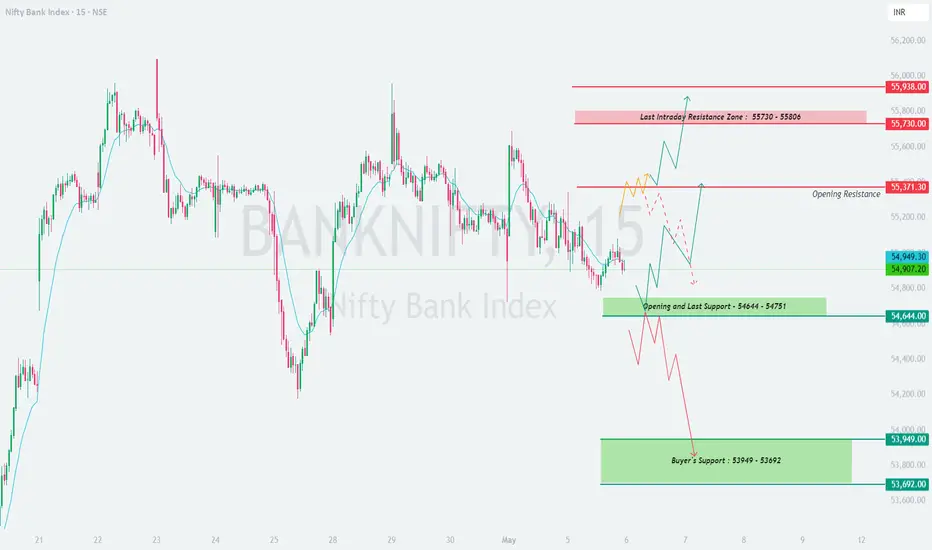
📍 Previous Close: 54,907
📌 Key Price Zones to Watch:
🔴 Opening Resistance: 55,371
🔺 Last Intraday Resistance Zone: 55,730 – 55,806
🚀 Breakout Target Zone: 55,938+
🟧 Opening and Last Support Zone: 54,644 – 54,751
🟩 Buyer's Strong Demand Zone: 53,949 – 53,692
🟥 Scenario 1: Gap-Up Opening (Above 55,371) 🚀
📚 Educational Insight: Gap-ups into resistance zones need confirmation of strength. Don't chase blindly—wait for price to sustain above supply areas with volume confirmation.
🟨 Scenario 2: Flat Opening (Between 54,949 – 54,644) ⚖️
📚 Educational Insight: Flat opens near support zones provide high risk-reward plays. Let the structure unfold before committing to a direction—watch for wick rejections and candle body closures.
🟩 Scenario 3: Gap-Down Opening (Below 54,644) 📉
📚 Educational Insight: Gap-downs into strong demand zones often create the best intraday bounce opportunities. React to price structure, not emotions.
⚠️ Options Trading Risk Management Tips 🛡️
📌 Summary & Conclusion:
✅ Gap-Up Opening Above 55,371: Strength only above 55,371; upside target 55,730–55,938. Watch for supply pressure and false breakouts.
✅ Flat Opening Between 54,949 – 54,644: Wait for breakout above 55,371 or breakdown below 54,644 for directional plays.
✅ Gap-Down Opening Below 54,644: Key bounce zone lies at 53,949 – 53,692. Best risk/reward trades may emerge from this zone.
🎯 Stay level-headed. Follow structure. Don't rush. Let price action confirm your view and manage risk like a professional.
⚠️ Disclaimer:
I am not a SEBI-registered analyst. The above analysis is for educational purposes only. Please consult a certified financial advisor before making any trading or investment decision.
(Gap Opening Consideration: 200+ Points | Price Structure & Level Oriented | Educational Purpose Only)
📍 Previous Close: 54,907
📌 Key Price Zones to Watch:
🔴 Opening Resistance: 55,371
🔺 Last Intraday Resistance Zone: 55,730 – 55,806
🚀 Breakout Target Zone: 55,938+
🟧 Opening and Last Support Zone: 54,644 – 54,751
🟩 Buyer's Strong Demand Zone: 53,949 – 53,692
🟥 Scenario 1: Gap-Up Opening (Above 55,371) 🚀
- [] If Bank Nifty opens above 55,371, it enters the "Opening Resistance" zone. This zone previously saw aggressive selling and may again attract supply.
[] Allow the first 15 minutes to complete—watch if price sustains above 55,371 or shows rejection signs (long wicks, inside bars, etc.).
[] If price sustains above 55,371, expect a gradual move toward the 55,730–55,806 zone. This is the Last Intraday Resistance and a critical decision-making level.
[] Strong volume and price action above 55,806 can invite breakout buying, targeting 55,938. - Be cautious of reversal traps if price opens above 55,371 but quickly slips below it—this could trigger a quick sell-off toward 54,949 – 54,751 support levels.
📚 Educational Insight: Gap-ups into resistance zones need confirmation of strength. Don't chase blindly—wait for price to sustain above supply areas with volume confirmation.
🟨 Scenario 2: Flat Opening (Between 54,949 – 54,644) ⚖️
- [] A flat open within this zone places Bank Nifty in a neutral territory, where both buyers and sellers are likely to test each other.
[] If price holds above 54,949 and breaks past 55,371, we can expect bullish continuation toward 55,730+ levels.
[] On the contrary, if the index fails to hold 54,949 and slips below 54,751, it could test the deeper support zone of 54,644.
[] Any breakdown below 54,644 may trigger a bearish leg targeting the next key support near 53,949 – 53,692, especially if accompanied by momentum and volume. - Be ready for range-bound moves if price gets trapped between 54,949 – 54,644. Use breakout/rejection setups to your advantage.
📚 Educational Insight: Flat opens near support zones provide high risk-reward plays. Let the structure unfold before committing to a direction—watch for wick rejections and candle body closures.
🟩 Scenario 3: Gap-Down Opening (Below 54,644) 📉
- [] A gap-down below 54,644 directly puts price near the Buyer's Support Zone of 53,949 – 53,692.
[] Avoid shorting blindly into this zone—this is where bulls could stage a comeback, especially if Bank Nifty forms reversal candles like hammers or bullish engulfing patterns.
[] A confirmation reversal from this zone can be a low-risk buying opportunity with stop loss just below 53,692 and a bounce target back to 54,644 – 54,751.
[] If price decisively breaks and sustains below 53,692, it may open doors for a fresh downside leg and panic selling—such breakdowns should only be played if volume supports the move. - Ideal strategy in this zone is "wait and react"—watch for bullish signals before buying, or breakdown confirmation before shorting.
📚 Educational Insight: Gap-downs into strong demand zones often create the best intraday bounce opportunities. React to price structure, not emotions.
⚠️ Options Trading Risk Management Tips 🛡️
- [] Always wait for the first 5–15 minutes post-opening before entering option trades to let premiums settle.
[] Define your maximum risk per trade (1–2% of capital) and stick to it—don’t average your losses.
[] Prefer ATM/ITM options for directional trades to reduce theta decay.
[] Use stop-loss on premium basis or underlying structure basis—whichever matches your plan.
[] Be mindful of sideways zones where premium erosion is fast—avoid taking trades unless a range breaks.
[] Consider vertical spreads in high IV environments to limit risk. - Maintain a trading journal to record setups, emotions, and execution discipline.
📌 Summary & Conclusion:
✅ Gap-Up Opening Above 55,371: Strength only above 55,371; upside target 55,730–55,938. Watch for supply pressure and false breakouts.
✅ Flat Opening Between 54,949 – 54,644: Wait for breakout above 55,371 or breakdown below 54,644 for directional plays.
✅ Gap-Down Opening Below 54,644: Key bounce zone lies at 53,949 – 53,692. Best risk/reward trades may emerge from this zone.
🎯 Stay level-headed. Follow structure. Don't rush. Let price action confirm your view and manage risk like a professional.
⚠️ Disclaimer:
I am not a SEBI-registered analyst. The above analysis is for educational purposes only. Please consult a certified financial advisor before making any trading or investment decision.
כתב ויתור
המידע והפרסומים אינם מיועדים להיות, ואינם מהווים, ייעוץ או המלצה פיננסית, השקעתית, מסחרית או מכל סוג אחר המסופקת או מאושרת על ידי TradingView. קרא עוד ב־תנאי השימוש.
כתב ויתור
המידע והפרסומים אינם מיועדים להיות, ואינם מהווים, ייעוץ או המלצה פיננסית, השקעתית, מסחרית או מכל סוג אחר המסופקת או מאושרת על ידי TradingView. קרא עוד ב־תנאי השימוש.