📊 Daily Support and Resistance Levels
Immediate Support: ₹1,204.27
Short-Term Support: ₹1,188.23
Key Resistance: ₹1,245.83
Short-Term Resistance: ₹1,233.07
🔁 Pivot Points (Daily)
Central Pivot Point (CPR): ₹1,217.03
Resistance Levels: ₹1,245.83, ₹1,261.87
Support Levels: ₹1,175.47, ₹1,188.23
📈 Technical Indicators
Relative Strength Index (RSI): Currently, the RSI is between 45 and 55, indicating a neutral market condition.
Moving Averages: The stock is trading near its short-term moving averages, suggesting a consolidation phase.
Volume: Moderate trading volume observed, indicating steady investor interest.
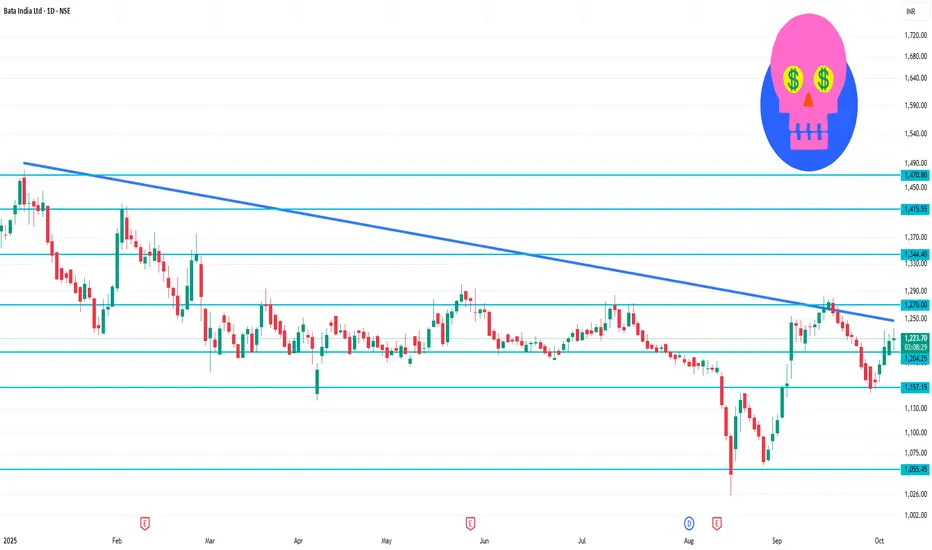
✅ Trade Insights
Bata India Ltd is currently in a neutral trend on the daily chart. A breakout above ₹1,245.83 could signal a bullish move towards ₹1,261.87. Conversely, a drop below ₹1,204.27 may indicate further downside.
Immediate Support: ₹1,204.27
Short-Term Support: ₹1,188.23
Key Resistance: ₹1,245.83
Short-Term Resistance: ₹1,233.07
🔁 Pivot Points (Daily)
Central Pivot Point (CPR): ₹1,217.03
Resistance Levels: ₹1,245.83, ₹1,261.87
Support Levels: ₹1,175.47, ₹1,188.23
📈 Technical Indicators
Relative Strength Index (RSI): Currently, the RSI is between 45 and 55, indicating a neutral market condition.
Moving Averages: The stock is trading near its short-term moving averages, suggesting a consolidation phase.
Volume: Moderate trading volume observed, indicating steady investor interest.
✅ Trade Insights
Bata India Ltd is currently in a neutral trend on the daily chart. A breakout above ₹1,245.83 could signal a bullish move towards ₹1,261.87. Conversely, a drop below ₹1,204.27 may indicate further downside.
פרסומים קשורים
כתב ויתור
המידע והפרסומים אינם אמורים להיות, ואינם מהווים, עצות פיננסיות, השקעות, מסחר או סוגים אחרים של עצות או המלצות שסופקו או מאושרים על ידי TradingView. קרא עוד בתנאים וההגבלות.
פרסומים קשורים
כתב ויתור
המידע והפרסומים אינם אמורים להיות, ואינם מהווים, עצות פיננסיות, השקעות, מסחר או סוגים אחרים של עצות או המלצות שסופקו או מאושרים על ידי TradingView. קרא עוד בתנאים וההגבלות.