שורט
Bitcoin Cash chart is still down
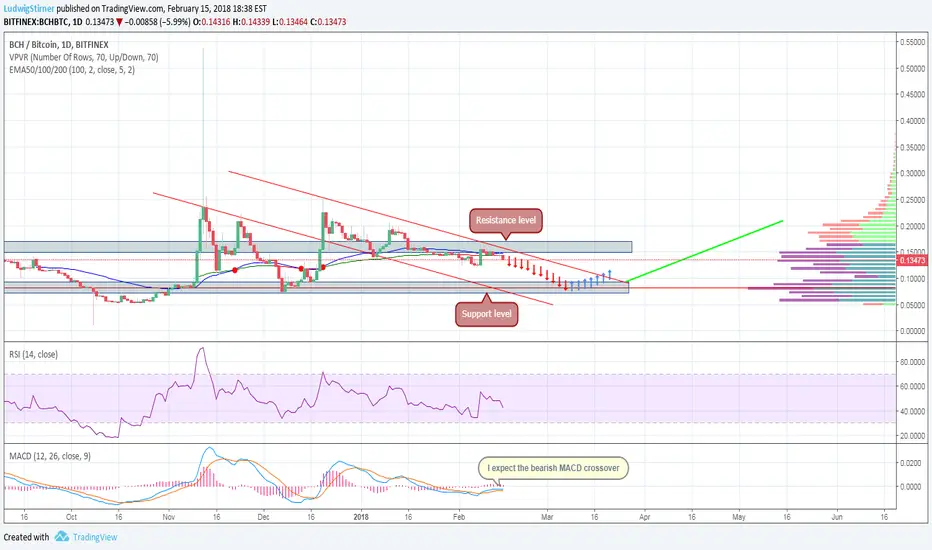
Long term, the trend of the Bitcoin Cash chart is still down. The 100-Day EMA provide significant resistance. The upper descending trend line also provide strong resistance.
RSI is below 50, a sign of an down trend. The MACD turned down but earlier the MACD showed positive divergence indicating the uptrend would begin however it might possible to be a fake buy signal.
RSI is below 50, a sign of an down trend. The MACD turned down but earlier the MACD showed positive divergence indicating the uptrend would begin however it might possible to be a fake buy signal.
כתב ויתור
המידע והפרסומים אינם אמורים להיות, ואינם מהווים, עצות פיננסיות, השקעות, מסחר או סוגים אחרים של עצות או המלצות שסופקו או מאושרים על ידי TradingView. קרא עוד בתנאים וההגבלות.
כתב ויתור
המידע והפרסומים אינם אמורים להיות, ואינם מהווים, עצות פיננסיות, השקעות, מסחר או סוגים אחרים של עצות או המלצות שסופקו או מאושרים על ידי TradingView. קרא עוד בתנאים וההגבלות.