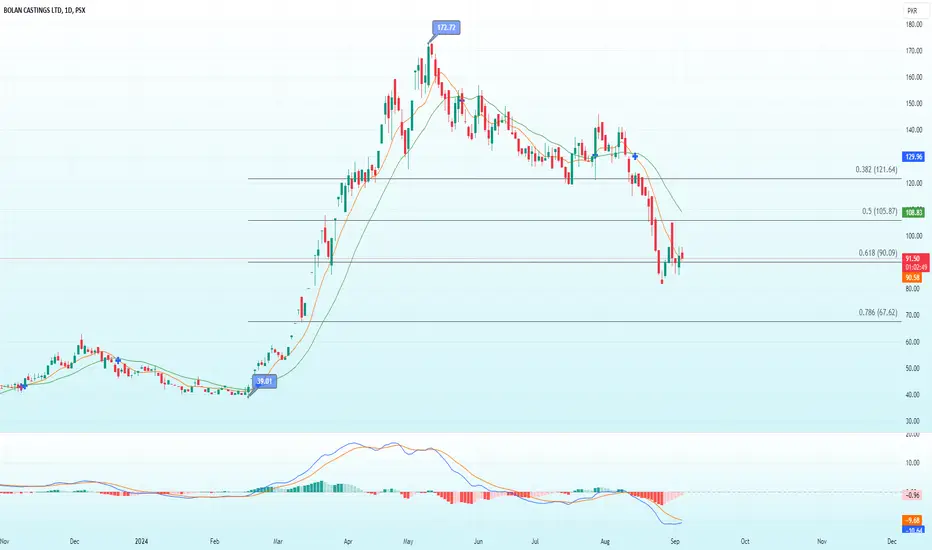
BCL is currently trading around its 200-day SMA and shows promising signs of a trend reversal. The MACD is below the zero line but nearing a bullish crossover, with the bearish histogram fading and potentially turning positive. Additionally, the stock is hovering above the 0.618 Fibonacci retracement level from Rs. 39.01 to Rs. 172.20, suggesting a potential recovery towards the 0.5 Fibonacci level at Rs. 105.87 and the 0.382 level at Rs. 121.64 (which aligns with the 50-day SMA). For a long position, consider entering as the recovery seems likely, with a stop loss set just below the previous low at Rs. 80.
הערה
Testing 0.618 Fib level, sustaining above shifts bullish reversalכתב ויתור
המידע והפרסומים אינם אמורים להיות, ואינם מהווים, עצות פיננסיות, השקעות, מסחר או סוגים אחרים של עצות או המלצות שסופקו או מאושרים על ידי TradingView. קרא עוד בתנאים וההגבלות.
כתב ויתור
המידע והפרסומים אינם אמורים להיות, ואינם מהווים, עצות פיננסיות, השקעות, מסחר או סוגים אחרים של עצות או המלצות שסופקו או מאושרים על ידי TradingView. קרא עוד בתנאים וההגבלות.