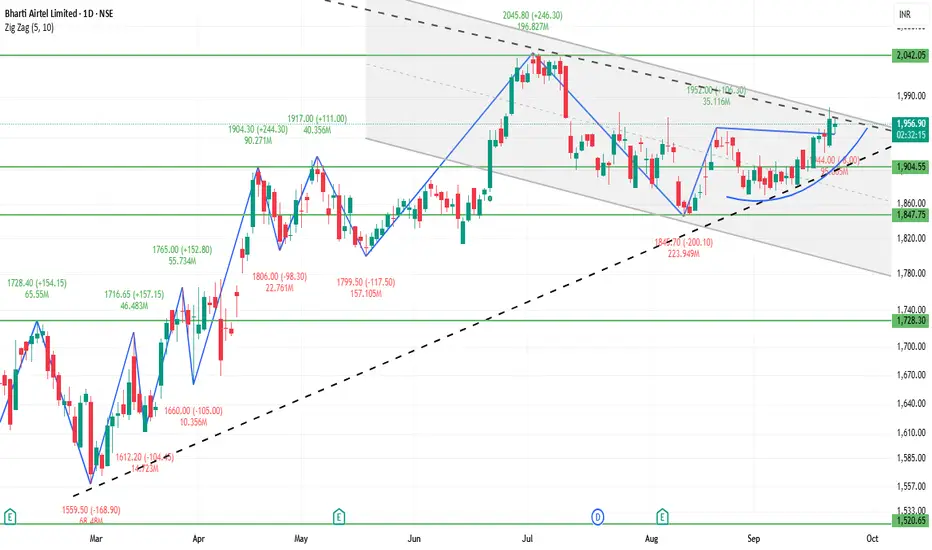
🔍 Current Price & Context
Trading around ₹1,950 – ₹1,960 (approx).
Day’s range recently: low ~ ₹1,944 – ₹1,946, high ~ ₹1,920 – ₹1,925 — showing testing of resistance.
52-week range: low ~ ₹1,510, high ~ ₹2,045.
🧮 Strategy / Trade Ideas
Long Setup:
Entry could be around / just above support zone (₹1,900 – ₹1,895) if there are reversal signals (bullish candles, volume).
Stop loss: slightly below deeper support (~₹1,870 – ₹1,880) to protect against breakdown.
Initial target: resistance around ₹1,920 – ₹1,930. If crossed, then next target near ₹1,950 – ₹1,960.
Short / Pullback Setup:
If price fails to break above resistance (~₹1,920 – ₹1,930) and shows signs of reversal (bearish candle, volume drop).
Target downward to support ~₹1,900, then further to ~₹1,880 – ₹1,870.
Breakout Setup:
If it breaks above ~₹1,950 – ₹1,960 with good volume, then move toward psychological level ~₹2,000 and possibly toward 52-week high (~₹2,045).
✅ Summary
Bharti Airtel in daily chart is showing a mild bullish bias, but the resistance zones (~₹1,920-₹1,930, ₹1,950-₹1,960) are critical. Holding above support around ₹1,900 is important. A clear breakout above resistance could open room for upside; failure to do so may lead to sideways movement or slight downside.
פרסומים קשורים
כתב ויתור
המידע והפרסומים אינם מיועדים להיות, ואינם מהווים, ייעוץ או המלצה פיננסית, השקעתית, מסחרית או מכל סוג אחר המסופקת או מאושרת על ידי TradingView. קרא עוד ב־תנאי השימוש.
פרסומים קשורים
כתב ויתור
המידע והפרסומים אינם מיועדים להיות, ואינם מהווים, ייעוץ או המלצה פיננסית, השקעתית, מסחרית או מכל סוג אחר המסופקת או מאושרת על ידי TradingView. קרא עוד ב־תנאי השימוש.