📉 1-Hour Technical Analysis Summary
Overall Signal: Strong Sell
Relative Strength Index (RSI): 41.43 — approaching oversold territory
MACD: -0.58 — indicating downward momentum
Stochastic Oscillator: 21.78 — confirming bearish bias
Average Directional Index (ADX): 54.36 — suggesting a strong trend
Williams %R: -76.66 — indicating oversold conditions
Commodity Channel Index (CCI): -68.24 — supporting bearish outlook
Pivot Levels:
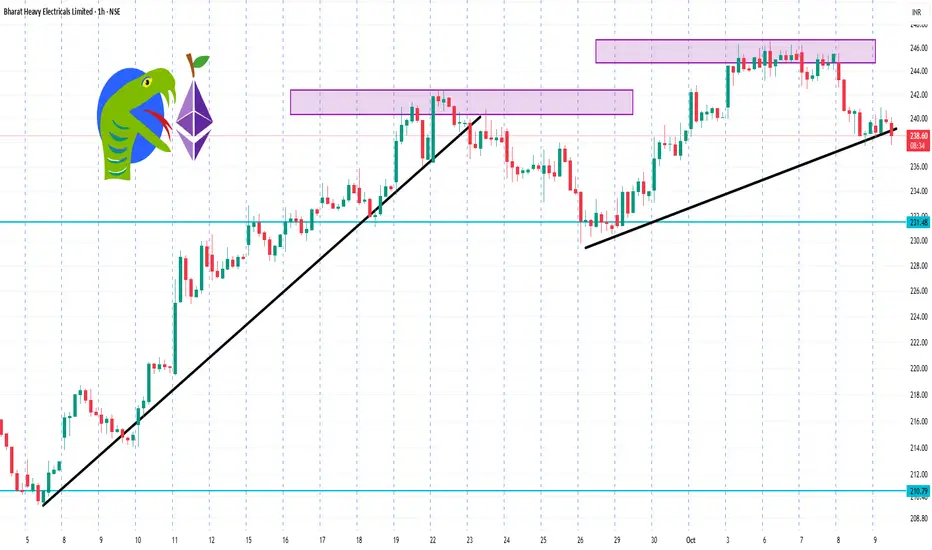
Support: S1 = ₹238.45
Resistance: R1 = ₹240.85
These indicators collectively suggest a continuation of the current downtrend.
🔍 Key Price Levels
Intraday Support: ₹236.19
Intraday Resistance: ₹243.64
Overall Signal: Strong Sell
Relative Strength Index (RSI): 41.43 — approaching oversold territory
MACD: -0.58 — indicating downward momentum
Stochastic Oscillator: 21.78 — confirming bearish bias
Average Directional Index (ADX): 54.36 — suggesting a strong trend
Williams %R: -76.66 — indicating oversold conditions
Commodity Channel Index (CCI): -68.24 — supporting bearish outlook
Pivot Levels:
Support: S1 = ₹238.45
Resistance: R1 = ₹240.85
These indicators collectively suggest a continuation of the current downtrend.
🔍 Key Price Levels
Intraday Support: ₹236.19
Intraday Resistance: ₹243.64
פרסומים קשורים
כתב ויתור
המידע והפרסומים אינם מיועדים להיות, ואינם מהווים, ייעוץ או המלצה פיננסית, השקעתית, מסחרית או מכל סוג אחר המסופקת או מאושרת על ידי TradingView. קרא עוד ב־תנאי השימוש.
פרסומים קשורים
כתב ויתור
המידע והפרסומים אינם מיועדים להיות, ואינם מהווים, ייעוץ או המלצה פיננסית, השקעתית, מסחרית או מכל סוג אחר המסופקת או מאושרת על ידי TradingView. קרא עוד ב־תנאי השימוש.