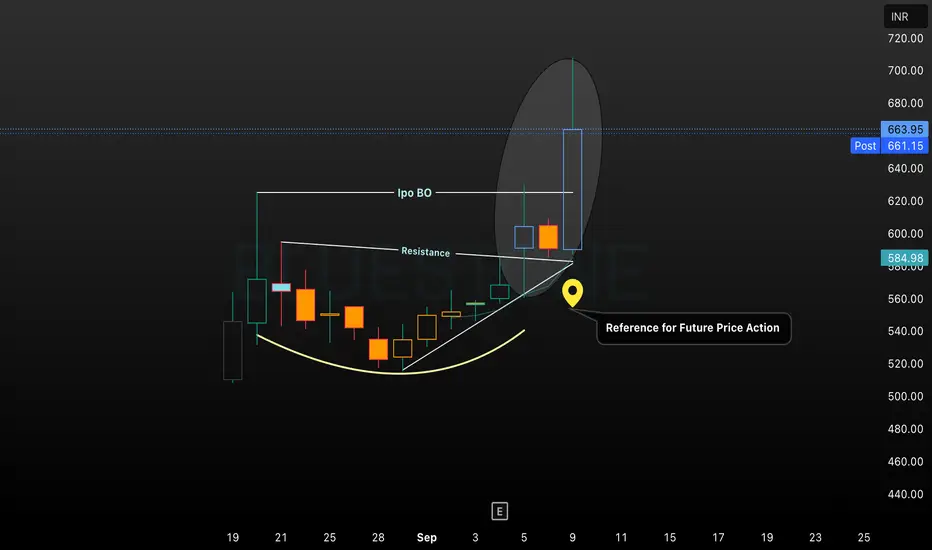
This chart analysis for Bluestone visualizes a bullish IPO breakout above resistance, confirmed by a rounded bottom base pattern and strong candle momentum. The highlighted reference marker identifies a crucial price level for monitoring future action, supporting technical study and trading decisions. Visual annotations emphasize breakout confirmation and the significance of post-breakout levels for trend continuation monitoring.
כתב ויתור
המידע והפרסומים אינם אמורים להיות, ואינם מהווים, עצות פיננסיות, השקעות, מסחר או סוגים אחרים של עצות או המלצות שסופקו או מאושרים על ידי TradingView. קרא עוד בתנאים וההגבלות.
כתב ויתור
המידע והפרסומים אינם אמורים להיות, ואינם מהווים, עצות פיננסיות, השקעות, מסחר או סוגים אחרים של עצות או המלצות שסופקו או מאושרים על ידי TradingView. קרא עוד בתנאים וההגבלות.