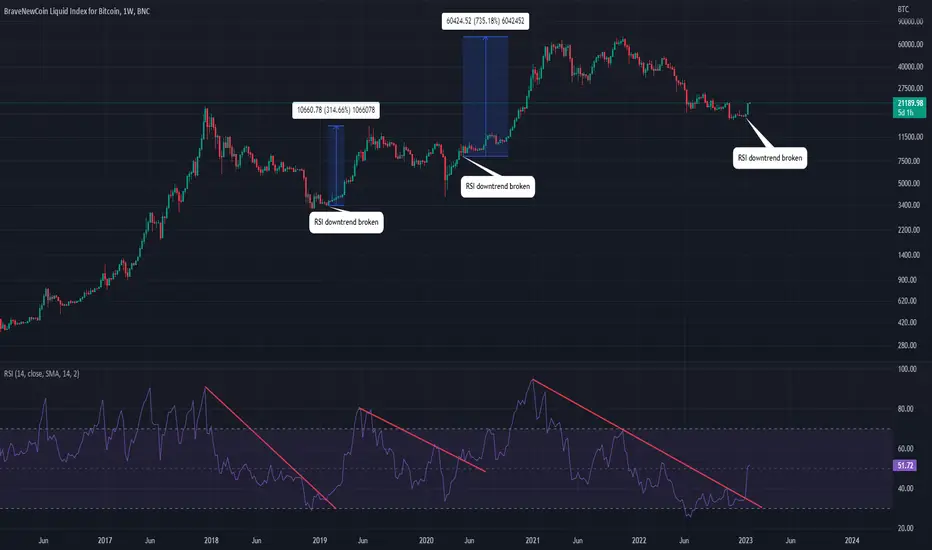
BTC has just recently breached its 2 year downtrend on the RSI. This is a very bullish indicator for the longer term. If we look back at 2018 we can see the RSI had a similar downwards sloping trendline that when broken led to a 300%+ pump. The second time this happened was during 2020. We had our downwards sloping trendline, broke above it and flipped it into new support before going on a 750%+ rally. Current day, we have just broken our downwards sloping trendline and have already almost pumped 40%. This does not mean we cannot have a retracement in the short term, but from a weekly perspective the bottom looks like it is in!
כתב ויתור
המידע והפרסומים אינם אמורים להיות, ואינם מהווים, עצות פיננסיות, השקעות, מסחר או סוגים אחרים של עצות או המלצות שסופקו או מאושרים על ידי TradingView. קרא עוד בתנאים וההגבלות.
כתב ויתור
המידע והפרסומים אינם אמורים להיות, ואינם מהווים, עצות פיננסיות, השקעות, מסחר או סוגים אחרים של עצות או המלצות שסופקו או מאושרים על ידי TradingView. קרא עוד בתנאים וההגבלות.