We told you earlier — mark our words. BNB is now on the verge of breaking into a new all-time high, and the chart has been signaling this move for months.
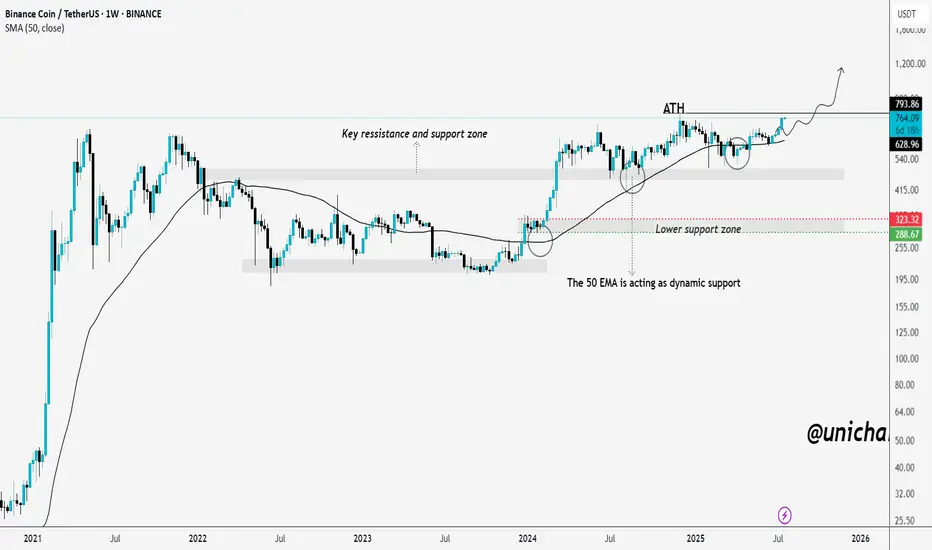
The price has consistently respected the key support-resistance zone around $500–$540, and the 50-week EMA has acted as dynamic support throughout the uptrend.
Each dip into the lower support zone between $290–$320 was quickly bought up, showing strong buyer interest and demand. After several healthy consolidations and retests, BNB is once again approaching the previous ATH around $793.
If it breaks above with strong volume, we could enter price discovery mode. All the signs are aligning — and if you caught the early setups, you’re already in a great position. If not, it’s time to stay sharp and watch this breakout zone closely.
The momentum is real, and the fireworks might just be getting started.
THANKS
כתב ויתור
המידע והפרסומים אינם מיועדים להיות, ואינם מהווים, ייעוץ או המלצה פיננסית, השקעתית, מסחרית או מכל סוג אחר המסופקת או מאושרת על ידי TradingView. קרא עוד ב־תנאי השימוש.
כתב ויתור
המידע והפרסומים אינם מיועדים להיות, ואינם מהווים, ייעוץ או המלצה פיננסית, השקעתית, מסחרית או מכל סוג אחר המסופקת או מאושרת על ידי TradingView. קרא עוד ב־תנאי השימוש.