Did you know that dominance is on the verge of collapsing in the coming days? Let me tell you why.
🔸On the 3-day dominance chart:
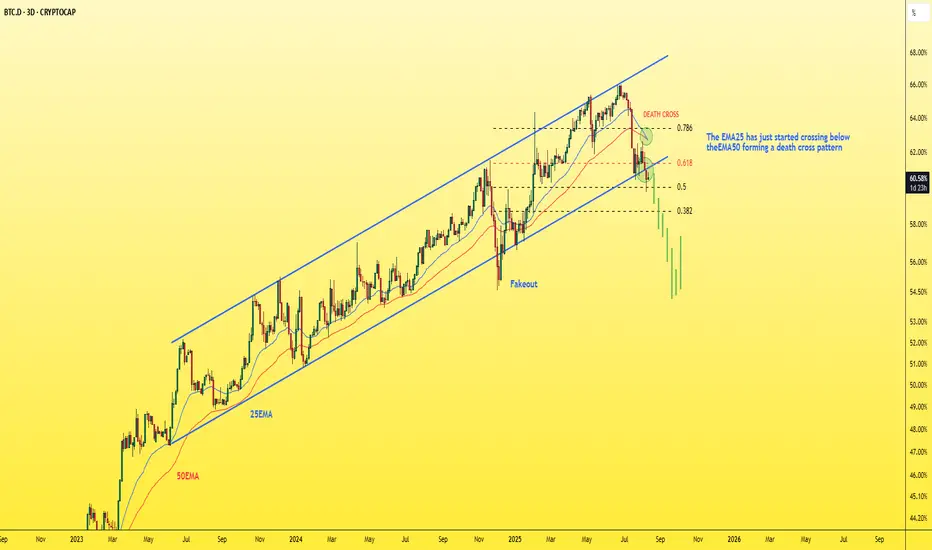
- We have the beginning of a break of the ascending channel, a close below it, and a retest.
- There’s also a break of an important support level at 0.618 Fibonacci, followed by a retest, and it’s currently trading below it.
- Plus, we have a death cross where the EMA25 crossed below the EMA50.
That’s three confirmations on one chart — can you imagine?
The coming days will likely see a strong pump in altcoins. Remember my words.
Best Regards:
Ceciliones🎯
🔸On the 3-day dominance chart:
- We have the beginning of a break of the ascending channel, a close below it, and a retest.
- There’s also a break of an important support level at 0.618 Fibonacci, followed by a retest, and it’s currently trading below it.
- Plus, we have a death cross where the EMA25 crossed below the EMA50.
That’s three confirmations on one chart — can you imagine?
The coming days will likely see a strong pump in altcoins. Remember my words.
Best Regards:
Ceciliones🎯
🔻 free telegram channel🔻
t.me/itradeoncrypto
🎯contact us For VIP services🎯
t.me/Cecilion1
t.me/itradeoncrypto
🎯contact us For VIP services🎯
t.me/Cecilion1
כתב ויתור
המידע והפרסומים אינם אמורים להיות, ואינם מהווים, עצות פיננסיות, השקעות, מסחר או סוגים אחרים של עצות או המלצות שסופקו או מאושרים על ידי TradingView. קרא עוד בתנאים וההגבלות.