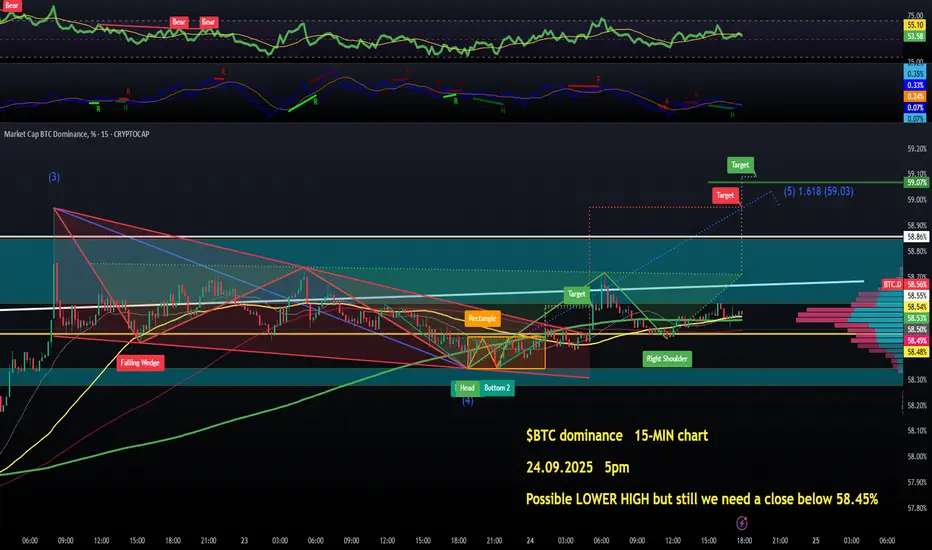
On the shortest timeframe I ever use for analysis, the 15-MIN chart it's looking like  BTC DOMINANCE could be starting to struggle with a very weak swing high right now, and under crucial resistances.
But to confirm this we basically need a breakdown below the immediate dynamic (50 & 200 SMAs, yellow and green right below the price, and just after a Golden Cross too) and horizontal support (yellow horizontal at 58.48%).
We really DON'T wanna see a breakout above the Inverse Head & Shoulders pattern (above 58.7%).
It's all simple for me, no leverage positions untilBTC DOMINANCE has decided what it wants to do👽💙
But to confirm this we basically need a breakdown below the immediate dynamic (50 & 200 SMAs, yellow and green right below the price, and just after a Golden Cross too) and horizontal support (yellow horizontal at 58.48%).
We really DON'T wanna see a breakout above the Inverse Head & Shoulders pattern (above 58.7%).
It's all simple for me, no leverage positions until
כתב ויתור
המידע והפרסומים אינם אמורים להיות, ואינם מהווים, עצות פיננסיות, השקעות, מסחר או סוגים אחרים של עצות או המלצות שסופקו או מאושרים על ידי TradingView. קרא עוד בתנאים וההגבלות.
כתב ויתור
המידע והפרסומים אינם אמורים להיות, ואינם מהווים, עצות פיננסיות, השקעות, מסחר או סוגים אחרים של עצות או המלצות שסופקו או מאושרים על ידי TradingView. קרא עוד בתנאים וההגבלות.