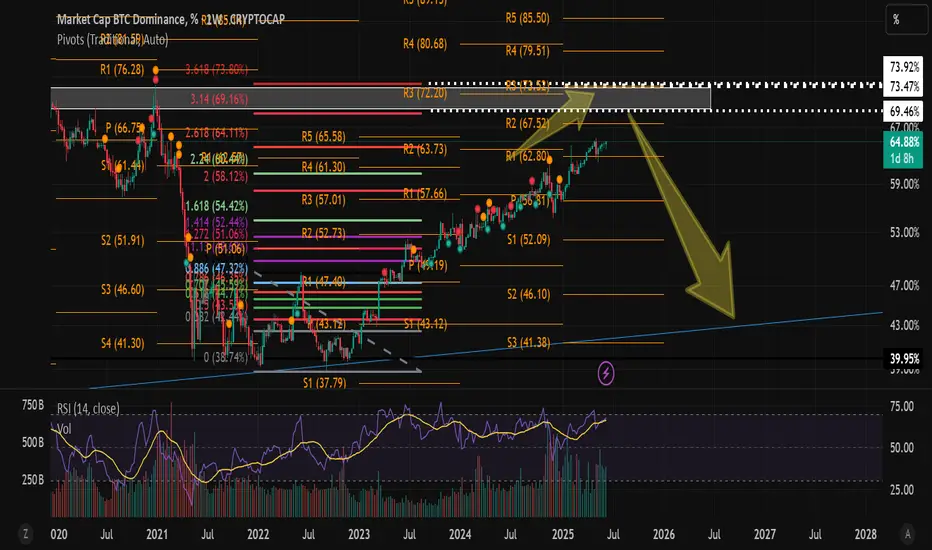
BTC Dominance is currently around 64.82%, sitting at a major multi-year resistance zone (64.5%–66.5%), with strong confluence from Fibonacci extensions, Pivot Points (R1 ~66.5%), and RSI (~67.24, near overbought).
This region has historically triggered reversals, and multiple indicators suggest exhaustion. The chart also projects a potential drop toward 52%, possibly 43–40%, aligning with key support levels and a long-term trendline.
Conclusion: BTC.D looks primed for a pullback, signaling the potential beginning of an altcoin rotation or altseason.
Disclaimer: This analysis is for educational purposes only and is purely speculative. It does not constitute financial advice. Always do your own research.
עסקה פעילה
This range appears to be marked at the top of the BTC.D chart with a white-dotted line and references the Fibonacci levels of 0.618 (69.46%) to 0.786 (73.92%), forming a major resistance zone.כתב ויתור
המידע והפרסומים אינם אמורים להיות, ואינם מהווים, עצות פיננסיות, השקעות, מסחר או סוגים אחרים של עצות או המלצות שסופקו או מאושרים על ידי TradingView. קרא עוד בתנאים וההגבלות.
כתב ויתור
המידע והפרסומים אינם אמורים להיות, ואינם מהווים, עצות פיננסיות, השקעות, מסחר או סוגים אחרים של עצות או המלצות שסופקו או מאושרים על ידי TradingView. קרא עוד בתנאים וההגבלות.