Chart Analysis
1. The Recent Unfilled Gap:
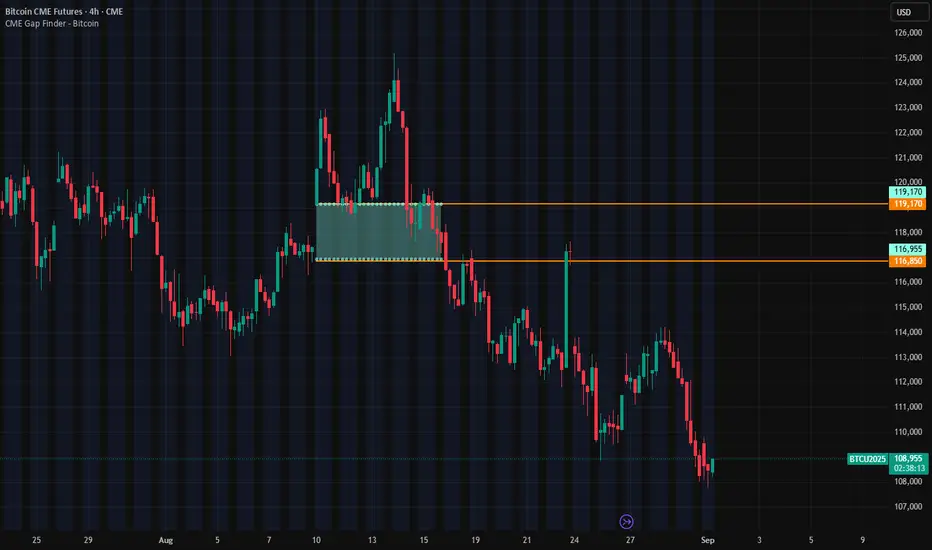
Location: In the top right section of the chart, there is a downward gap.
Price: This gap is situated between the two orange lines, in the price range of $116,050 to $119,170.
Current Status: As the chart shows, the current Bitcoin price is around $108,720, and this gap remains unfilled. This suggests that the price may have a tendency to move upwards to fill this gap in the future.
2. The Previous Filled Gap:
Location: A smaller gap is visible on the left side of the chart.
Current Status: This gap has already been filled, which means the price returned to that level at some point and closed the gap.
Key Takeaways
Overall Trend: The chart indicates that after reaching a high of approximately $124,000, the price has entered a corrective and downward trend.
Importance of Gaps: CME gaps are considered key levels in technical analysis. The current unfilled gap could act as a potential resistance, but many traders view it as a price target and expect the price to eventually reach that level.
In summary, this chart clearly shows a large, unfilled gap above the current Bitcoin price, which could influence the future price movement.
1. The Recent Unfilled Gap:
Location: In the top right section of the chart, there is a downward gap.
Price: This gap is situated between the two orange lines, in the price range of $116,050 to $119,170.
Current Status: As the chart shows, the current Bitcoin price is around $108,720, and this gap remains unfilled. This suggests that the price may have a tendency to move upwards to fill this gap in the future.
2. The Previous Filled Gap:
Location: A smaller gap is visible on the left side of the chart.
Current Status: This gap has already been filled, which means the price returned to that level at some point and closed the gap.
Key Takeaways
Overall Trend: The chart indicates that after reaching a high of approximately $124,000, the price has entered a corrective and downward trend.
Importance of Gaps: CME gaps are considered key levels in technical analysis. The current unfilled gap could act as a potential resistance, but many traders view it as a price target and expect the price to eventually reach that level.
In summary, this chart clearly shows a large, unfilled gap above the current Bitcoin price, which could influence the future price movement.
כתב ויתור
המידע והפרסומים אינם מיועדים להיות, ואינם מהווים, ייעוץ או המלצה פיננסית, השקעתית, מסחרית או מכל סוג אחר המסופקת או מאושרת על ידי TradingView. קרא עוד ב־תנאי השימוש.
כתב ויתור
המידע והפרסומים אינם מיועדים להיות, ואינם מהווים, ייעוץ או המלצה פיננסית, השקעתית, מסחרית או מכל סוג אחר המסופקת או מאושרת על ידי TradingView. קרא עוד ב־תנאי השימוש.