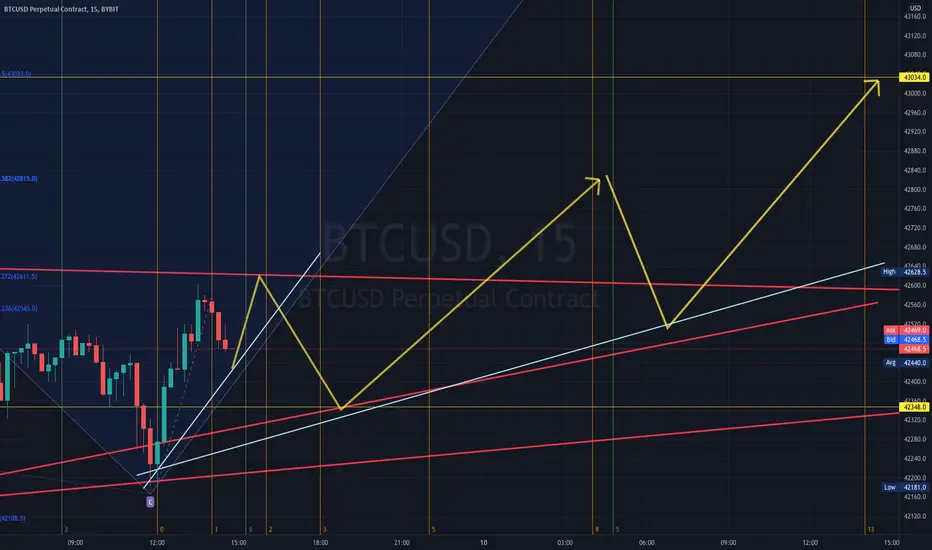
Using Fibonacci/ harmonic patterns - this chart shows in general what price action may do over the next 8 hours.
*with certainty price will not follow this chart precisely (it's possible it may not follow at all)
posting charts like this keeps me sharp and constantly improving - as posting this publicly adds pressure to my charting - to constantly improve on accuracy.
Do not trade around this chart as well as it is entirely speculative, however it could be used as a reference if price action is following this general movement
As always good luck and best regards
כתב ויתור
המידע והפרסומים אינם אמורים להיות, ואינם מהווים, עצות פיננסיות, השקעות, מסחר או סוגים אחרים של עצות או המלצות שסופקו או מאושרים על ידי TradingView. קרא עוד בתנאים וההגבלות.
כתב ויתור
המידע והפרסומים אינם אמורים להיות, ואינם מהווים, עצות פיננסיות, השקעות, מסחר או סוגים אחרים של עצות או המלצות שסופקו או מאושרים על ידי TradingView. קרא עוד בתנאים וההגבלות.