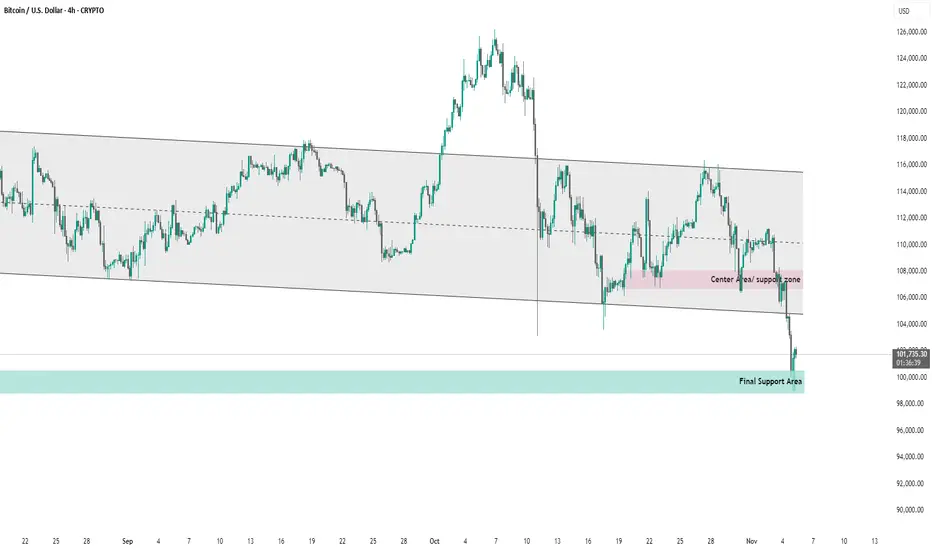
This chart shows Bitcoin (BTC/USD) price action on the 4-hour timeframe within a descending channel.
The price has consistently respected the upper and lower bounds of the channel, indicating a prevailing downtrend.
A center area/support zone around $107,000–$109,000 acted as interim support but has recently been broken.
The price has now reached the final support area near $100,000–$101,000, which is currently being tested.
If this final support fails, it could signal a continuation of the bearish trend; otherwise, a bounce from this level might lead to a short-term retracement toward the mid-channel zone.
Overall, the chart highlights a critical support test within a broader bearish structure.
פרסומים קשורים
כתב ויתור
המידע והפרסומים אינם מיועדים להיות, ואינם מהווים, ייעוץ או המלצה פיננסית, השקעתית, מסחרית או מכל סוג אחר המסופקת או מאושרת על ידי TradingView. קרא עוד ב־תנאי השימוש.
כתב ויתור
המידע והפרסומים אינם מיועדים להיות, ואינם מהווים, ייעוץ או המלצה פיננסית, השקעתית, מסחרית או מכל סוג אחר המסופקת או מאושרת על ידי TradingView. קרא עוד ב־תנאי השימוש.