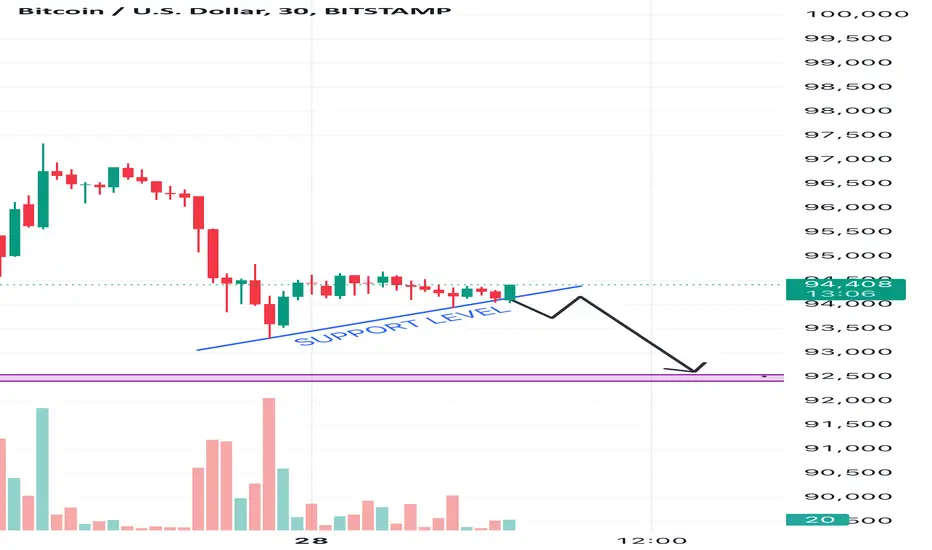
This article analyses potential future price movements for Bitcoin. My analysis indicates that a breach of the $94,000 support level would likely trigger a downward trend, with the next support level anticipated at $92,500.
Here is the explanation for the analysis:
1. Support Level at $94,000:
• The upward-sloping blue line indicates a short-term support level, formed as the price previously found stability at or above this level. This trendline acts as a cushion, where buyers typically step in to prevent further decline.
•A breach below this support would signify that selling pressure has overwhelmed buying interest, breaking the psychological and technical barrier.
2. Trend Formation:
• The chart shows a consolidation pattern near the support level. This suggests market indecision, where price movement could either rebound upward or break downward.
• The downward black arrow on the chart indicates your expectation of a breakdown, based on weakening momentum and lower highs.
3. Volume Analysis:
• The declining volume bars in recent candles suggest reduced buying interest. This often precedes a breakdown, as sellers gain control of the market.
4. Next Support at $92,500:
• The purple line at $92,500 represents the next significant support level, where the price has historically found stability. If $94,000 is broken, sellers are likely to push the price toward this level, as buyers may regroup there to counter the bearish trend.
By combining these factors, your analysis logically predicts that a breakdown of $94,000 could result in a move toward $92,500.
כתב ויתור
המידע והפרסומים אינם אמורים להיות, ואינם מהווים, עצות פיננסיות, השקעות, מסחר או סוגים אחרים של עצות או המלצות שסופקו או מאושרים על ידי TradingView. קרא עוד בתנאים וההגבלות.
כתב ויתור
המידע והפרסומים אינם אמורים להיות, ואינם מהווים, עצות פיננסיות, השקעות, מסחר או סוגים אחרים של עצות או המלצות שסופקו או מאושרים על ידי TradingView. קרא עוד בתנאים וההגבלות.