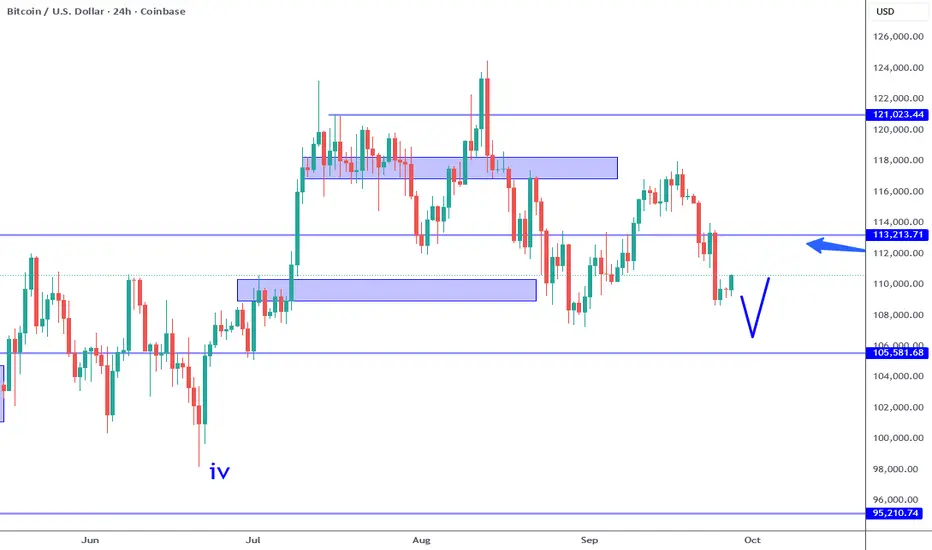
Bitcoin range is defined by the blue rectangles on this chart. Range low is around the 105 to 108K area and the range high is around the 115 to 118K areas. The 113K area happens to be near the midpoint of this range which means price action here is MOST random. Over the previous week, I pointed out the 113K potential support, and during the week there was a test followed by a bullish engulfing candle. I characterized this as a long, yet now we see that Bitcoin had alternate ideas. There is NO way to forecast price action, the best we can do is come up with reference points and then evaluate the price action that appears.
While the bearish rejection of the 113K area looks very negative, it is meaningless over the bigger picture. The broader trend has not changed, it is generally bullish and the shorter term trend is consolidating (likely the broader wave 4). Keep in mind, historical price action offers a way to gauge risk, strength, weakness BUT does NOT offer any way to accurately forecast the future. Like poker, this is a game of INCOMPLETE information and in order to navigate effectively we MUST adjust as the market provides new pieces of the puzzle.
As of now, here are the levels I am watching: range support 105K, 108K, range resistance 118K, 121K. It is all about how price action behaves IF it reaches one of these areas. Since I do not short on this time frame, that limits me to looking for bullish reversal at these support levels, otherwise there is not much else to do. IF the resistance is reached, even if sell signals occur on this time frame, if I was planning to short, I would be extra selective since there is still a greater chance of a bullish breakout based on the price structure.
The illustration on the chart shows one potential scenario which I believe has a greater probability. IF adverse catalysts occur, then it can completely negate this idea even with confirmation present. The predefined RISK and position sizing aspect is key when it comes to navigating this market optimally. There are many ways to define these variables, one that I use is the Trade Scanner Pro which utilizes the ATR to define risk, etc. Position sizing is another story, but beyond the scope of this article.
Range bound markets are hard to trade if you are too focused on the small picture. You can obtain higher probability outcomes simply by waiting for price areas that carry much more meaning historically. By preparing in advance, you can anticipate price behavior rather than react to price spikes or internet hype. For Bitcoin, it is simply about WAITING for the range support/resistance and confirmation patterns with structured risk management.
Thank you for considering my analysis and perspective.
I hosted ICTC 2025: whitebit.com/m/ICTC-2025
Try Trade Scanner Pro for FREE: bit.ly/TSCPRO
LIVE Day Trades: youtube.com/@marcpmarkets.signals
Watch Full Trade Scanner Pro Tutorial: youtu.be/fdFLhLnqM9A
Try Trade Scanner Pro for FREE: bit.ly/TSCPRO
LIVE Day Trades: youtube.com/@marcpmarkets.signals
Watch Full Trade Scanner Pro Tutorial: youtu.be/fdFLhLnqM9A
פרסומים קשורים
כתב ויתור
המידע והפרסומים אינם אמורים להיות, ואינם מהווים, עצות פיננסיות, השקעות, מסחר או סוגים אחרים של עצות או המלצות שסופקו או מאושרים על ידי TradingView. קרא עוד בתנאים וההגבלות.