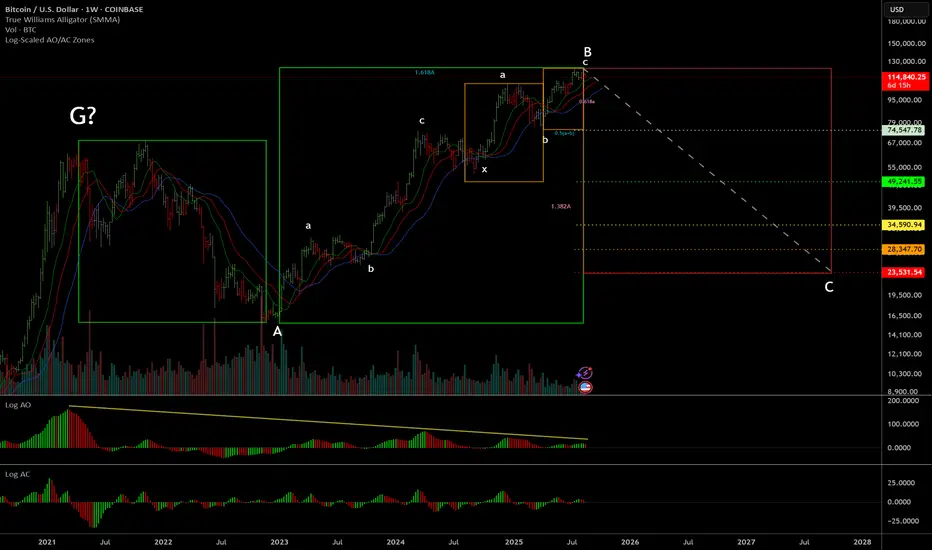
BTC has formed into a double zigzag from the low in 2023 until now. This is the same count that my friend Glenn Neely (the founder of Neowave) is following.
At this point there aren't really any other counts that appear to make sense. Especially considering the terminal impulse that wave-c has formed (see Daily chart).

We've already begun breaking down from the rising wedge pattern, which is a strong indication that wave-c has concluded.
Beyond just Elliott Wave/Neowave considerations, this has also formed long-term momentum divergences on the AO, and a clear weekly wiseman right at the end of wave-5 of c, perfectly aligned with the 0.5(a+b) time target for wave-c.
This perfect confluence of signals here is a very strong signal the market has topped out long-term, and could retrace all the way back to ~$23k in the worst case scenario. Other potential retracement levels are labeled on the chart.
If this does end up breaking $125k, then it may be a good idea to flip bullish as the bull cycle could continue for an unknown amount of time after that. For now, probabilities are starting to stack up indicating that the top is in and a big retracement is coming.
At this point there aren't really any other counts that appear to make sense. Especially considering the terminal impulse that wave-c has formed (see Daily chart).
We've already begun breaking down from the rising wedge pattern, which is a strong indication that wave-c has concluded.
Beyond just Elliott Wave/Neowave considerations, this has also formed long-term momentum divergences on the AO, and a clear weekly wiseman right at the end of wave-5 of c, perfectly aligned with the 0.5(a+b) time target for wave-c.
This perfect confluence of signals here is a very strong signal the market has topped out long-term, and could retrace all the way back to ~$23k in the worst case scenario. Other potential retracement levels are labeled on the chart.
If this does end up breaking $125k, then it may be a good idea to flip bullish as the bull cycle could continue for an unknown amount of time after that. For now, probabilities are starting to stack up indicating that the top is in and a big retracement is coming.
הערה
From a William's perspective, I see this long-term set up as exceedingly bearish:
2D and 3D charts have closed under the gator. Both charts have all three wisemen. Both charts have created multi-peaks and have crossed or are approaching the zero line on the AO.
1W and 1M both have first wisemen (1M closes in 2 days).
Virtually all charts have twin or multi-peaks, long-term divergences, and are beginning to turn red on the AO.
This all aligns perfectly with the Wave theory price/time/structure targets which indicate that we've already hit the top. We've also retraced wave-5 of c faster than it was formed, broken down clearly from the rising wedge pattern, and even retested the bottom trendline before heading lower. (see daily rising wedge chart)
The only bullish thing to note on these charts is the 1D first wisemen, but this signal is fairly weak given the rest of the set up.
On the flip side, in the less likely scenario where this does break up above $125k and reverse the long-term wisemen and other signals, it would be a strong buy signal. However, that alternative scenario seems much less likely at this point, so unless it does break $125k, it's best to remain bearish based on Neowave theory and William's indicators.
עסקה פעילה
Given that we are starting to veer off course here, unless we see a sharp move down this week, the terminal count for wave-c is probably incorrect and we could still see more upside from here.
The terminal is not totally invalid yet, and even if we get one more wave up it's possible that this last dip was wave-4 and the next wave up will be wave-5 of c. But it's also possible a wider bull market continuation could happen from this point IF the long-term top signals are invalidated AND a wave-5 doesn't form after the invalidation.
At the least, the very short-term seems to be pointing up now while the long-term is still awaiting a confirmation (or invalidation) of the long-term top signals. Given the very early-stage nature of the top signals, the probability that they will hold is not extremely high, but high enough to warrant some level of caution as long as they still remain valid.
Find me on x.com/intuit_trading
כתב ויתור
המידע והפרסומים אינם אמורים להיות, ואינם מהווים, עצות פיננסיות, השקעות, מסחר או סוגים אחרים של עצות או המלצות שסופקו או מאושרים על ידי TradingView. קרא עוד בתנאים וההגבלות.
Find me on x.com/intuit_trading
כתב ויתור
המידע והפרסומים אינם אמורים להיות, ואינם מהווים, עצות פיננסיות, השקעות, מסחר או סוגים אחרים של עצות או המלצות שסופקו או מאושרים על ידי TradingView. קרא עוד בתנאים וההגבלות.
