A detailed analysis of Bitcoin's recent price action reveals a market exhibiting clear signs of a sustained bearish phase. The most telling technical development is the establishment of a consistent pattern of lower lows. This occurs when each successive peak of selling pressure drives the price to a trough that is deeper than the one before it. This pattern is one of the most fundamental confirmations of a downtrend, as it demonstrates that sellers are not only active but are successfully asserting their dominance with increasing force, creating a staircase effect downward on the charts.
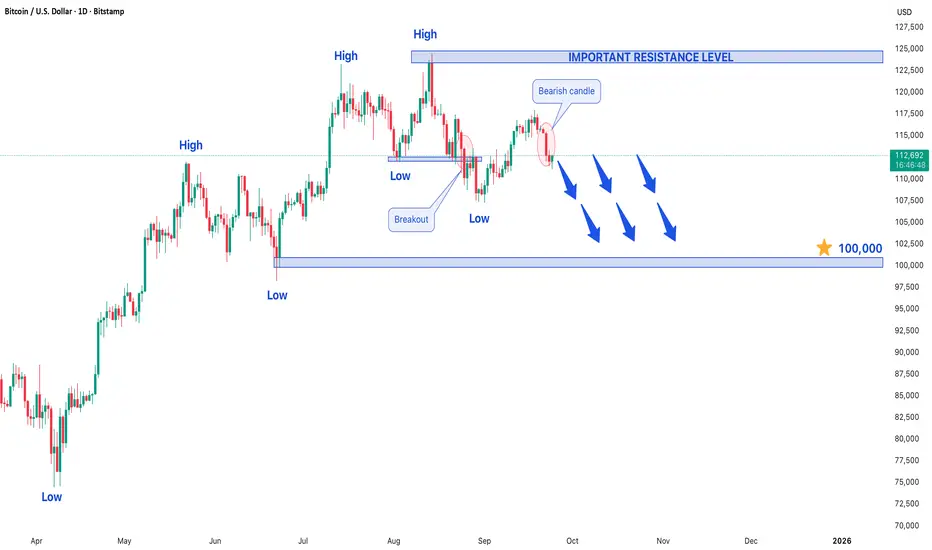
Compounding this negative outlook is the repeated appearance of bearish engulfing candlestick patterns. These formations are particularly significant for traders, as they capture a sharp shift in momentum within a discrete time period. A bearish engulfing candle materializes when a period of optimistic buying, represented by a green or white candle, is immediately followed by a larger red or black candle that completely "engulfs" the real body of the prior session. This indicates that any initial buying enthusiasm was decisively overwhelmed by a surge of selling activity, often leading to a reversal of any minor uptrends. The presence of these patterns suggests that any short-term rallies are likely being perceived as selling opportunities rather than genuine reversals, effectively snuffing out nascent bullish sentiment.
The confluence of these two technical indicators—the sequential lower lows and the confirmation from bearish engulfing candles—paints a compelling picture for the near-term trajectory. As a result, the market expectation is firmly tilted towards continued bearish momentum in the upcoming trading sessions. The path of least resistance appears skewed to the downside, with momentum favoring the sellers.
Given this outlook, key price levels become critically important for forecasting potential moves. On the lower side, the focus shifts to a significant support zone around the $100,000 mark. This level is not only a major psychological round number but also a technical area where buyers may historically step in. A breach below this substantial support could potentially trigger accelerated selling, leading to a steeper decline.
Conversely, any attempt at a bullish recovery will face a formidable challenge at the $124,500 level. This price point has been established as a key resistance barrier. For the current bearish narrative to be invalidated, Bitcoin would need to muster enough buying volume to achieve a decisive and sustained breakout above this ceiling. Until such an event occurs, this resistance level will likely act as a powerful cap on upward movements, reinforcing the prevailing downward trend and defining the upper boundary for any corrective bounces.
כתב ויתור
המידע והפרסומים אינם אמורים להיות, ואינם מהווים, עצות פיננסיות, השקעות, מסחר או סוגים אחרים של עצות או המלצות שסופקו או מאושרים על ידי TradingView. קרא עוד בתנאים וההגבלות.
כתב ויתור
המידע והפרסומים אינם אמורים להיות, ואינם מהווים, עצות פיננסיות, השקעות, מסחר או סוגים אחרים של עצות או המלצות שסופקו או מאושרים על ידי TradingView. קרא עוד בתנאים וההגבלות.