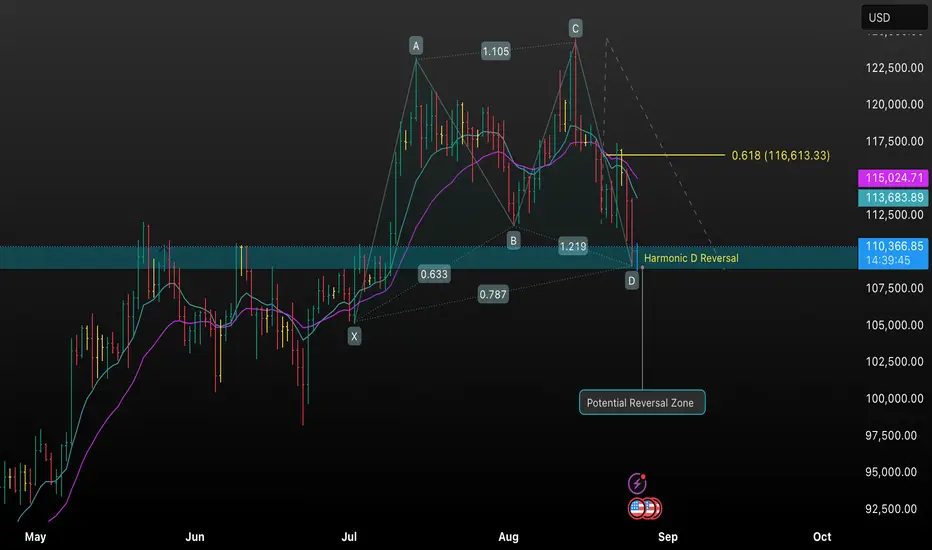
This TradingView chart analyzes Bitcoin (BTCUSD) using a harmonic pattern approach, illustrating the price pathway through significant XABCD points. The “Potential Reversal Zone” (PRZ) and Harmonic D completion area suggest a possible bullish reversal. Key Fibonacci retracement levels, moving averages, and support-resistance zones inform the analysis, providing actionable insights for swing traders and technical analy
כתב ויתור
המידע והפרסומים אינם מיועדים להיות, ואינם מהווים, ייעוץ או המלצה פיננסית, השקעתית, מסחרית או מכל סוג אחר המסופקת או מאושרת על ידי TradingView. קרא עוד ב־תנאי השימוש.
כתב ויתור
המידע והפרסומים אינם מיועדים להיות, ואינם מהווים, ייעוץ או המלצה פיננסית, השקעתית, מסחרית או מכל סוג אחר המסופקת או מאושרת על ידי TradingView. קרא עוד ב־תנאי השימוש.