This Post contains some of the data from the chats organized into groups. at the bottom of this post I will point out some interesting observations I saw. Importantly, patterns may seem to exist in these cycles, but that doesn’t mean they actually do. Especially now that Bitcoin has matured and obtained institutional adoption. This is more for fun than anything
———————————-———————————-———————————-———————————-
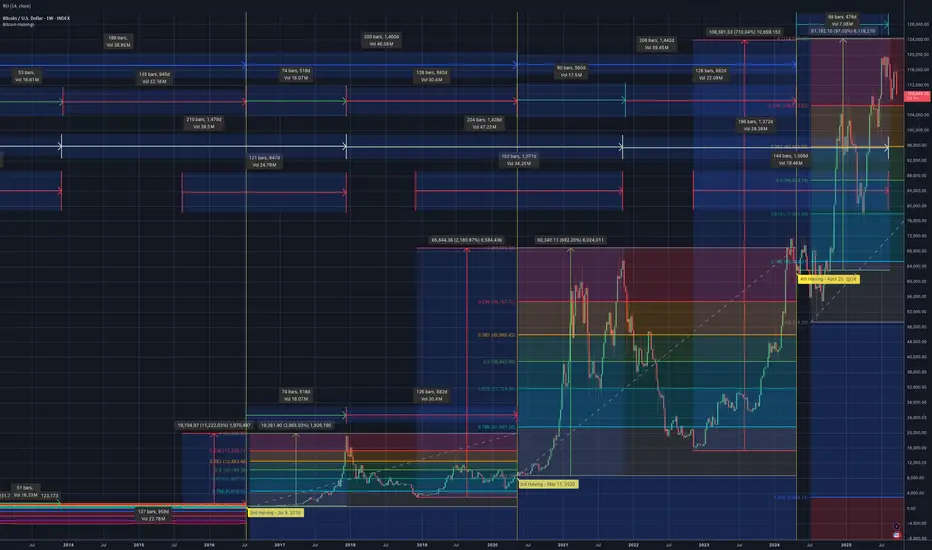
The lines and their meanings, top of chart to bottom of chart
———————————-———————————-———————————-———————————-
top blue line = Days between Halving's
green arrow = Days from Halving to ATH
Red arrow = days after ATH to next halving
white arrow = Days between ATHs
red arrow = Days from bottom of bear to next cycles ATH
green up arrow = percent price change from start of halving to ATH
Red up arrow = percent price change from bottom of bear marker to next cycles ATH
———————————-———————————-———————————-———————————-
Data Summary + extra evaluations
———————————-———————————-———————————-———————————-
-- Halving Dates --
Oct 9th, 2009 (NOT a halving, first BTC sale)
November 28th, 2012
July 9th, 2016
May 11th, 2020
April 11th, 2024
-- Start of Halving to ATH (in days) --
2009 > 609
2012 > 317
2016 > 518
2020 > 560
2024 > 483
-- Days between ATHs --
2009 > No previous ATH
2012 > 910
2016 > 1470
2020 > 1428
2024 > 1372
-- Days between bottom of bear to next ATH --
2009 > 609
2012 > 756
2016 > 847
2020 > 1071
2024 > 1407
-- Start of Halving to ATH (percent change)--
2009 > 2,796,268%
2012 > 11,159%
2016 > 3,329%
2020 > 715%
2024 > 100%
-- Bottom of bear to next cycles ATH --
2009 > No previous bottom
2012 > 57,000%
2016 > 11,146%
2020 > 2,190%
2024 > 710%
———————————-———————————-———————————-———————————-
Comparing Percentage Gains to Pervious Halving Cycle
———————————-———————————-———————————-———————————-
— Start of Halving to ATH (percent change)—
2009 > 2,796,268% (no previous halving).
2012 > 11,159% (250X less than 2009).
2016 > 3,329% (3.35X less than 2012).
2020 > 715% (4.65X less than 2016).
2024 > 100% (7.15X less than 2020)
— Bottom of bear to next cycles ATH —
2009 > X (no previous bottom).
2012 > 57,000%.
2016 > 11,146% (5.11X less than 2012).
2020 > 2,190% (5.10X less than 2016).
2024 > 710% (3.08X less than 2020).
———————————-———————————-———————————-———————————-
Fun Observations
———————————-———————————-———————————-———————————-
———————————-———————————-———————————-———————————-
----— Interesting Observation #1 —----
———————————-———————————-———————————-———————————-
The previous cycles “Bottom of bear to ATH” is extremely similar to the next cycles
“start of halving to ATH” Breakdown:
~~~
2012 Halving to ATH = 11,159%
Bottom bear to 2016 Halving ATH = 11,146%
~~~
2016 Halving to ATH = 3,329%
Bottom bear to 2020 Halving ATH = 2,190%
~~~
2020 Halving to ATH = 715%
Bottom bear to 2024 Halving ATH = 710%
~~~
———————————-———————————-———————————-———————————-
---— Interesting Observation #2 —---
———————————-———————————-———————————-———————————-
The number of “Days between bottom of bear to next ATH” are increasing by about 25% each cycle:
2009 > 609 (used first sale, no perv bear)
2012 > 756 (24% longer than 2009)
2016 > 847 (12% longer than 2012)
2020 > 1071 (26% longer than 2016)
2024 > 1407 (31% longer than 2020)
———————————-———————————-———————————-———————————-
Some notes about the chart
———————————-———————————-———————————-———————————-
** please note **
1. these images all uses the 1 week chart, so days are not 100% accurate, they are off by a few days. Unfortunately the 1 day chart was to zoomed out to see all at once.
2. the price changes are as close as I could get, may be a tiny tiny bit off the actual bear bottom price or all time high price
3. I used the second peak of the 2020 cycle for the ATH
———————————-———————————-———————————-———————————-
The lines and their meanings, top of chart to bottom of chart
———————————-———————————-———————————-———————————-
top blue line = Days between Halving's
green arrow = Days from Halving to ATH
Red arrow = days after ATH to next halving
white arrow = Days between ATHs
red arrow = Days from bottom of bear to next cycles ATH
green up arrow = percent price change from start of halving to ATH
Red up arrow = percent price change from bottom of bear marker to next cycles ATH
———————————-———————————-———————————-———————————-
Data Summary + extra evaluations
———————————-———————————-———————————-———————————-
-- Halving Dates --
Oct 9th, 2009 (NOT a halving, first BTC sale)
November 28th, 2012
July 9th, 2016
May 11th, 2020
April 11th, 2024
-- Start of Halving to ATH (in days) --
2009 > 609
2012 > 317
2016 > 518
2020 > 560
2024 > 483
-- Days between ATHs --
2009 > No previous ATH
2012 > 910
2016 > 1470
2020 > 1428
2024 > 1372
-- Days between bottom of bear to next ATH --
2009 > 609
2012 > 756
2016 > 847
2020 > 1071
2024 > 1407
-- Start of Halving to ATH (percent change)--
2009 > 2,796,268%
2012 > 11,159%
2016 > 3,329%
2020 > 715%
2024 > 100%
-- Bottom of bear to next cycles ATH --
2009 > No previous bottom
2012 > 57,000%
2016 > 11,146%
2020 > 2,190%
2024 > 710%
———————————-———————————-———————————-———————————-
Comparing Percentage Gains to Pervious Halving Cycle
———————————-———————————-———————————-———————————-
— Start of Halving to ATH (percent change)—
2009 > 2,796,268% (no previous halving).
2012 > 11,159% (250X less than 2009).
2016 > 3,329% (3.35X less than 2012).
2020 > 715% (4.65X less than 2016).
2024 > 100% (7.15X less than 2020)
— Bottom of bear to next cycles ATH —
2009 > X (no previous bottom).
2012 > 57,000%.
2016 > 11,146% (5.11X less than 2012).
2020 > 2,190% (5.10X less than 2016).
2024 > 710% (3.08X less than 2020).
———————————-———————————-———————————-———————————-
Fun Observations
———————————-———————————-———————————-———————————-
———————————-———————————-———————————-———————————-
----— Interesting Observation #1 —----
———————————-———————————-———————————-———————————-
The previous cycles “Bottom of bear to ATH” is extremely similar to the next cycles
“start of halving to ATH” Breakdown:
~~~
2012 Halving to ATH = 11,159%
Bottom bear to 2016 Halving ATH = 11,146%
~~~
2016 Halving to ATH = 3,329%
Bottom bear to 2020 Halving ATH = 2,190%
~~~
2020 Halving to ATH = 715%
Bottom bear to 2024 Halving ATH = 710%
~~~
———————————-———————————-———————————-———————————-
---— Interesting Observation #2 —---
———————————-———————————-———————————-———————————-
The number of “Days between bottom of bear to next ATH” are increasing by about 25% each cycle:
2009 > 609 (used first sale, no perv bear)
2012 > 756 (24% longer than 2009)
2016 > 847 (12% longer than 2012)
2020 > 1071 (26% longer than 2016)
2024 > 1407 (31% longer than 2020)
———————————-———————————-———————————-———————————-
Some notes about the chart
———————————-———————————-———————————-———————————-
** please note **
1. these images all uses the 1 week chart, so days are not 100% accurate, they are off by a few days. Unfortunately the 1 day chart was to zoomed out to see all at once.
2. the price changes are as close as I could get, may be a tiny tiny bit off the actual bear bottom price or all time high price
3. I used the second peak of the 2020 cycle for the ATH
כתב ויתור
המידע והפרסומים אינם אמורים להיות, ואינם מהווים, עצות פיננסיות, השקעות, מסחר או סוגים אחרים של עצות או המלצות שסופקו או מאושרים על ידי TradingView. קרא עוד בתנאים וההגבלות.
כתב ויתור
המידע והפרסומים אינם אמורים להיות, ואינם מהווים, עצות פיננסיות, השקעות, מסחר או סוגים אחרים של עצות או המלצות שסופקו או מאושרים על ידי TradingView. קרא עוד בתנאים וההגבלות.