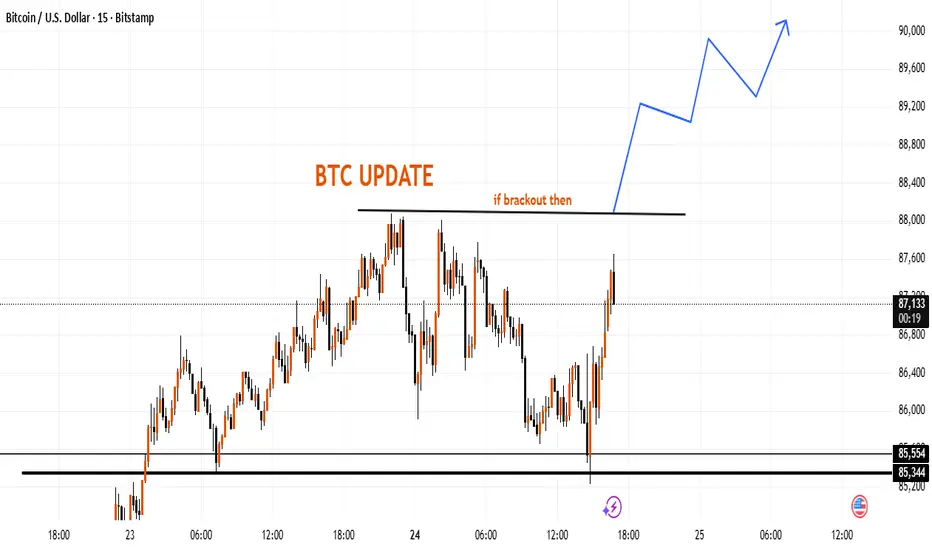
This chart highlights an important resistance zone around the 88,000 area. If price manages to move firmly above this level, the market may continue forming a higher-timeframe structure toward the 89,000–90,000 region.
The lower zone near 85,300–85,550 remains a notable support area where previous reactions occurred.
This outline is based purely on market structure and potential price behavior, not a trading instruction.
The lower zone near 85,300–85,550 remains a notable support area where previous reactions occurred.
This outline is based purely on market structure and potential price behavior, not a trading instruction.
עסקה פעילה
its time to trade activeעסקה סגורה: היעד הושג
target compleateכתב ויתור
המידע והפרסומים אינם מיועדים להיות, ואינם מהווים, ייעוץ או המלצה פיננסית, השקעתית, מסחרית או מכל סוג אחר המסופקת או מאושרת על ידי TradingView. קרא עוד ב־תנאי השימוש.
כתב ויתור
המידע והפרסומים אינם מיועדים להיות, ואינם מהווים, ייעוץ או המלצה פיננסית, השקעתית, מסחרית או מכל סוג אחר המסופקת או מאושרת על ידי TradingView. קרא עוד ב־תנאי השימוש.