I have provided a few reasons above that support a correction is likely on the way for BTC.
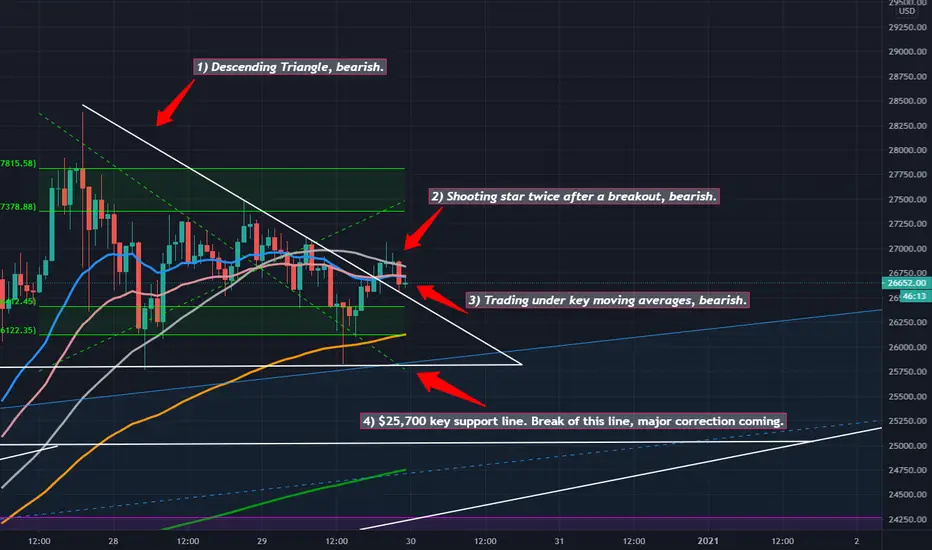
1) Descending Triangle, key support line, at around $25,700 now. A move and close below this line in next few hours will be very bearish.
2) A breakout from the descending triangle forming a shooting star pattern at hourly chart shows bears are working hard to press the price downward. In other words, bulls are losing their strength now.
3) For further confirmation we need to wait for the candle to drop back into the descending triangle to know it was a false breakout.
4) BTC is trading below some key hourly moving averages now.
5) Line $25,700 has been touched twice, a third touch could send BTC downward now, bulls therefore must protect this level for us to have more upside confidence.
Stop loss can be placed around $25,500 or $25,000 to stop you out from further losses.
Hope this helps you! God bless!
הערה
BTC just broke below the descending triangle support line, this confirms a false breakout.כתב ויתור
המידע והפרסומים אינם אמורים להיות, ואינם מהווים, עצות פיננסיות, השקעות, מסחר או סוגים אחרים של עצות או המלצות שסופקו או מאושרים על ידי TradingView. קרא עוד בתנאים וההגבלות.
כתב ויתור
המידע והפרסומים אינם אמורים להיות, ואינם מהווים, עצות פיננסיות, השקעות, מסחר או סוגים אחרים של עצות או המלצות שסופקו או מאושרים על ידי TradingView. קרא עוד בתנאים וההגבלות.