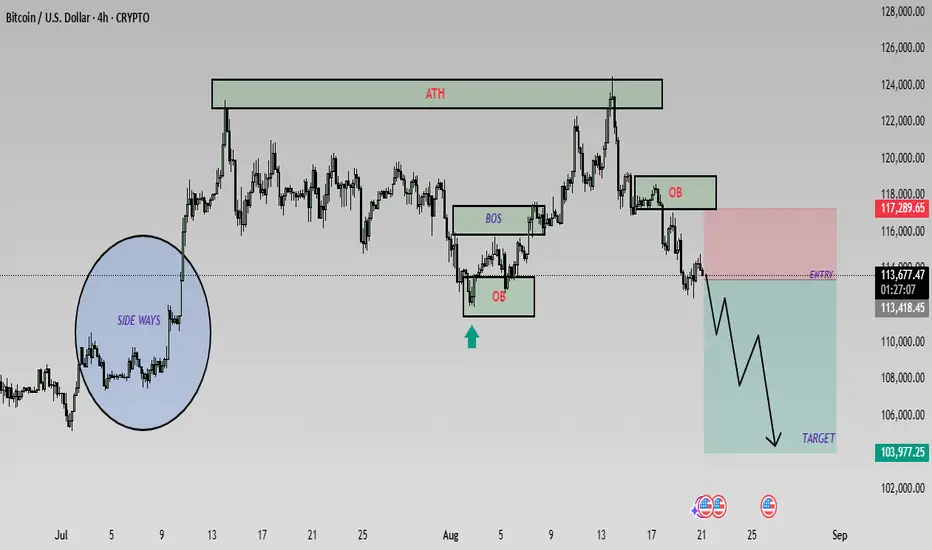
On the 4H BTC/USD chart, the structure shows a clear journey through phases of consolidation, expansion, and correction. The market first spent time in a sideways range before breaking out, pushing toward the ATH (All-Time High) zone. From there, strong reactions emerged, leading to a shift in momentum.
Key points like BOS (Break of Structure) and OB (Order Block) highlight how the market transitioned from bullish continuation to potential distribution. Price is now reacting below a previously tested zone, with sellers maintaining pressure. The projected path illustrates how momentum could continue seeking lower levels, but the chart mainly underlines how BTC respects major supply and demand areas while flowing through cycles of strength and weakness.
Key points like BOS (Break of Structure) and OB (Order Block) highlight how the market transitioned from bullish continuation to potential distribution. Price is now reacting below a previously tested zone, with sellers maintaining pressure. The projected path illustrates how momentum could continue seeking lower levels, but the chart mainly underlines how BTC respects major supply and demand areas while flowing through cycles of strength and weakness.
t.me/+rMqTj9GOJvJhMWU0
Full-time trader | Technical Analyst
Specialized in Forex, Gold & Crypto
Sharing high-probability setups & market insights.
t.me/+rMqTj9GOJvJhMWU0
Not here to predict. Here to prepare."
Full-time trader | Technical Analyst
Specialized in Forex, Gold & Crypto
Sharing high-probability setups & market insights.
t.me/+rMqTj9GOJvJhMWU0
Not here to predict. Here to prepare."
כתב ויתור
המידע והפרסומים אינם אמורים להיות, ואינם מהווים, עצות פיננסיות, השקעות, מסחר או סוגים אחרים של עצות או המלצות שסופקו או מאושרים על ידי TradingView. קרא עוד בתנאים וההגבלות.
t.me/+rMqTj9GOJvJhMWU0
Full-time trader | Technical Analyst
Specialized in Forex, Gold & Crypto
Sharing high-probability setups & market insights.
t.me/+rMqTj9GOJvJhMWU0
Not here to predict. Here to prepare."
Full-time trader | Technical Analyst
Specialized in Forex, Gold & Crypto
Sharing high-probability setups & market insights.
t.me/+rMqTj9GOJvJhMWU0
Not here to predict. Here to prepare."
כתב ויתור
המידע והפרסומים אינם אמורים להיות, ואינם מהווים, עצות פיננסיות, השקעות, מסחר או סוגים אחרים של עצות או המלצות שסופקו או מאושרים על ידי TradingView. קרא עוד בתנאים וההגבלות.