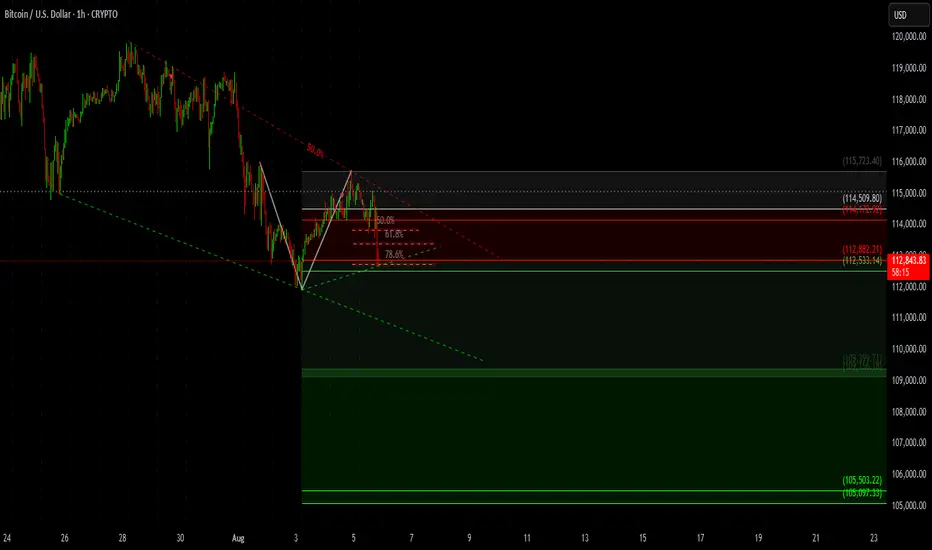
Bearish Pennant forming — price is consolidating within a descending triangle/pennant after a sharp drop, indicating a possible continuation.
🔺 Key Resistance Zones:
$114,509 – $114,742 (marked with dark red zone)
Fibonacci 50% – 61.8% levels aligning with this resistance zone
🔻 Support Zones:
$112,533 (current 78.6% fib retracement acting as intraday support)
$109,320 – $108,720 (potential bounce zone)
$105,503 – $105,097 (final bearish target if breakdown continues)
📐 Fibonacci Retracement Levels
Price retraced to 50%–61.8% and is now testing lower levels.
Breakdown from this region confirms bearish pressure.
📈 Bias: Bearish below $113,000
📉 Next Potential Target:
Short-term: $109,300
Medium-term: $105,000
💬 Conclusion: BTC is showing weakness after a failed breakout and rejection from fib resistance. If $112,500 breaks, expect acceleration toward $109K and possibly $105K.
כתב ויתור
המידע והפרסומים אינם אמורים להיות, ואינם מהווים, עצות פיננסיות, השקעות, מסחר או סוגים אחרים של עצות או המלצות שסופקו או מאושרים על ידי TradingView. קרא עוד בתנאים וההגבלות.
כתב ויתור
המידע והפרסומים אינם אמורים להיות, ואינם מהווים, עצות פיננסיות, השקעות, מסחר או סוגים אחרים של עצות או המלצות שסופקו או מאושרים על ידי TradingView. קרא עוד בתנאים וההגבלות.