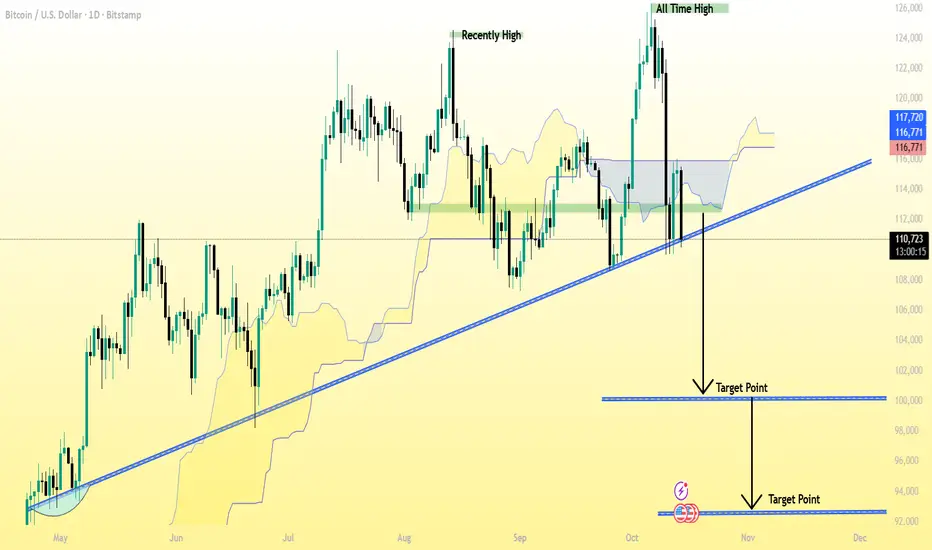
BTC/USD (Bitcoin) 1D (Daily) chart 👇
✅ Current Price: around $110,685
✅ Trend: Bearish breakdown — price has clearly broken below the long-term ascending trendline.
✅ Market structure: After rejecting near $117,000, BTC dropped below both the Ichimoku cloud and the trendline — confirming downside pressure.
---
🎯 Target Levels (Downside)
1. Primary Target: $100,000 – $98,000
This matches my first marked “Target Point”.
It’s a strong historical support zone and aligns with previous price consolidation.
2. Extended / Final Target: $94,000 – $92,000
This is the second target point shown on my chart.
It would be the next major support if BTC continues falling after $98,000 breaks.
---
🛡 Resistance / Stop-Loss
Immediate resistance: $113,000 – $114,000 (broken trendline retest zone).
Stop-loss for short trades: above $115,000 – $116,000 (invalidates bearish setup).
---
🔍 Summary
Trend bias: Bearish (break of trendline + below cloud)
Sell zone: $111,000 – $113,000
Target 1: $100,000 – $98,000
Target 2: $94,000 – $93,000
Stop-loss: above $115,000
עסקה פעילה
trade activeכתב ויתור
המידע והפרסומים אינם אמורים להיות, ואינם מהווים, עצות פיננסיות, השקעות, מסחר או סוגים אחרים של עצות או המלצות שסופקו או מאושרים על ידי TradingView. קרא עוד בתנאים וההגבלות.
כתב ויתור
המידע והפרסומים אינם אמורים להיות, ואינם מהווים, עצות פיננסיות, השקעות, מסחר או סוגים אחרים של עצות או המלצות שסופקו או מאושרים על ידי TradingView. קרא עוד בתנאים וההגבלות.