🔹 1. Historic Bear Market Drops Are Identical
Each cycle produced almost the same percentage crash from top to bottom:
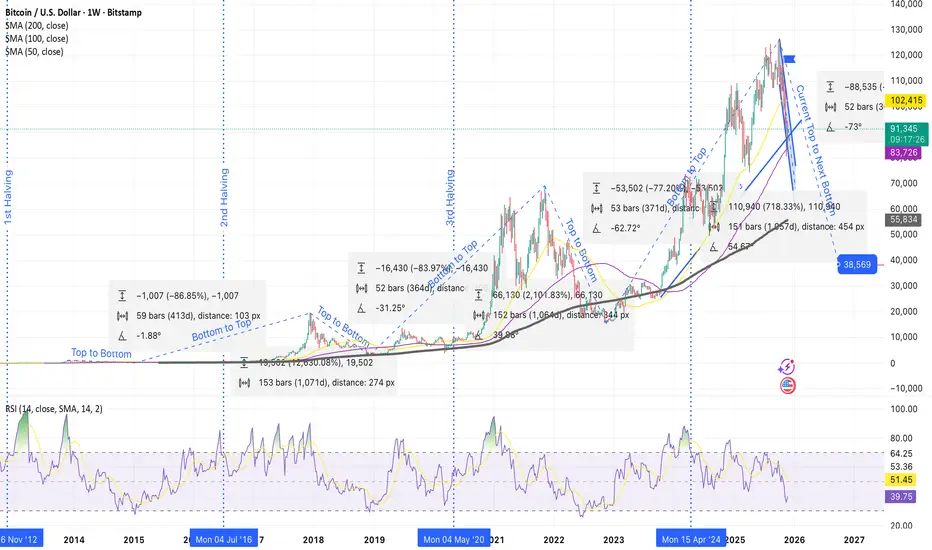
• Cycle 1: –86.85%
• Cycle 2: –83.97%
• Cycle 3: –77.20%
• Current Cycle (Projection): –70% to –75%
Every cycle becomes slightly less volatile, but the pattern is still the same:
The top is always followed by a huge correction.
⸻
🔹 2. The Cycle Durations Are Nearly Perfect Copies
Top → Bottom timing
• Cycle 1: 59 weeks
• Cycle 2: 52 weeks
• Cycle 3: 53 weeks
• Current projection: ~52 weeks
⏳ Every major Bitcoin top takes ~1 year to reach the bottom.
Bottom → Next Top timing
• Cycle 1: ~1070 days
• Cycle 2: ~1057 days
• Cycle 3: ~1057 days
• Current cycle follows the same length exactly.
⸻
🔹 3. Bitcoin Always Bottoms Near the 200-Week SMA
Every cycle bottom touches or slightly dips below the 200-week moving average (black line).
Your projection shows the same thing happening again:
📉 Projected BTC bottom: ~$38,000 – $40,000
Exactly where the 200-week SMA and long-term trendline converge.
⸻
🔹 4. Current Cycle Is Following the Previous One Perfectly
Your chart overlays show:
• The 2025 top mirrors the 2021 top
• The decline angle is almost identical
• RSI is falling the same way it did in every bear market start
• The projected drop of –70% from the 2025 top leads directly to the $38K bottom zone
This is the same structure as:
• 2013 → 2015
• 2017 → 2018
• 2021 → 2022
⸻
🔹 5. What’s Next?
If Bitcoin continues to follow its 4-year cycle:
📉 Bear Market Bottom: ~$38K in 2026
📈 Next Major Bull Run: 2026–2028
🏁 Major Cycle Top: around 2028–2029
⸻
🧠 “Bitcoin has never broken its 4-year cycle. Each top is followed by a –70% bear market, and each bottom leads into the next halving bull run.”
📜 Disclaimer: This is general information only and not financial advice.
Each cycle produced almost the same percentage crash from top to bottom:
• Cycle 1: –86.85%
• Cycle 2: –83.97%
• Cycle 3: –77.20%
• Current Cycle (Projection): –70% to –75%
Every cycle becomes slightly less volatile, but the pattern is still the same:
The top is always followed by a huge correction.
⸻
🔹 2. The Cycle Durations Are Nearly Perfect Copies
Top → Bottom timing
• Cycle 1: 59 weeks
• Cycle 2: 52 weeks
• Cycle 3: 53 weeks
• Current projection: ~52 weeks
⏳ Every major Bitcoin top takes ~1 year to reach the bottom.
Bottom → Next Top timing
• Cycle 1: ~1070 days
• Cycle 2: ~1057 days
• Cycle 3: ~1057 days
• Current cycle follows the same length exactly.
⸻
🔹 3. Bitcoin Always Bottoms Near the 200-Week SMA
Every cycle bottom touches or slightly dips below the 200-week moving average (black line).
Your projection shows the same thing happening again:
📉 Projected BTC bottom: ~$38,000 – $40,000
Exactly where the 200-week SMA and long-term trendline converge.
⸻
🔹 4. Current Cycle Is Following the Previous One Perfectly
Your chart overlays show:
• The 2025 top mirrors the 2021 top
• The decline angle is almost identical
• RSI is falling the same way it did in every bear market start
• The projected drop of –70% from the 2025 top leads directly to the $38K bottom zone
This is the same structure as:
• 2013 → 2015
• 2017 → 2018
• 2021 → 2022
⸻
🔹 5. What’s Next?
If Bitcoin continues to follow its 4-year cycle:
📉 Bear Market Bottom: ~$38K in 2026
📈 Next Major Bull Run: 2026–2028
🏁 Major Cycle Top: around 2028–2029
⸻
🧠 “Bitcoin has never broken its 4-year cycle. Each top is followed by a –70% bear market, and each bottom leads into the next halving bull run.”
📜 Disclaimer: This is general information only and not financial advice.
כתב ויתור
המידע והפרסומים אינם מיועדים להיות, ואינם מהווים, ייעוץ או המלצה פיננסית, השקעתית, מסחרית או מכל סוג אחר המסופקת או מאושרת על ידי TradingView. קרא עוד ב־תנאי השימוש.
כתב ויתור
המידע והפרסומים אינם מיועדים להיות, ואינם מהווים, ייעוץ או המלצה פיננסית, השקעתית, מסחרית או מכל סוג אחר המסופקת או מאושרת על ידי TradingView. קרא עוד ב־תנאי השימוש.