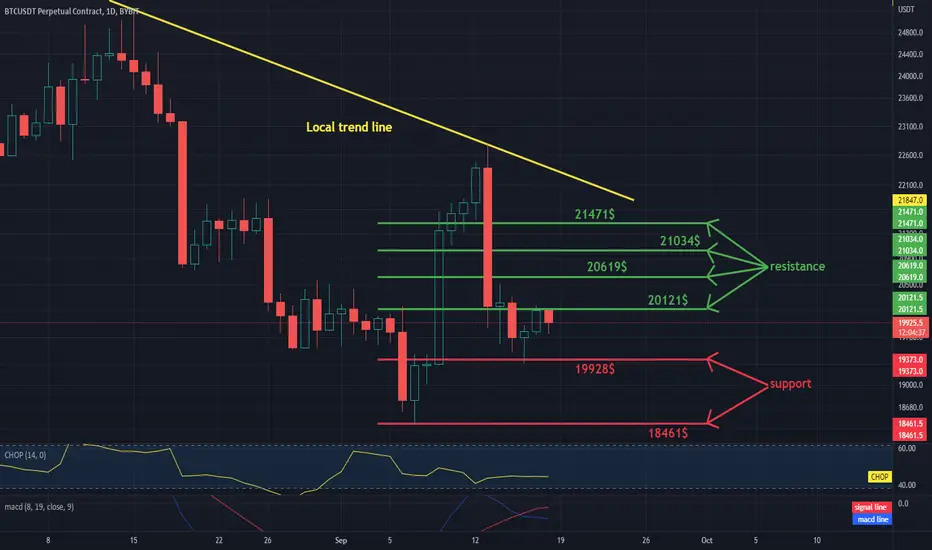
Hello everyone, let's take a look at the BTC to USDT chart on a 1 day time frame. As you can see, the price is moving below the local downtrend line.
Let's start with the designation of the support line and as you can see the first support in the near future is $ 19,928, if the support breaks down, the next support is $ 18,461.
Now let's move from the resistance line as you can see the first resistance is $ 20121, if you can break it the next resistance will be $ 20,619, $ 21,034 and $ 21,471.
Looking at the CHOP indicator, we can see that in the 1-day interval we have little energy and the MACD indicator shows a local downward trend.
כתב ויתור
המידע והפרסומים אינם אמורים להיות, ואינם מהווים, עצות פיננסיות, השקעות, מסחר או סוגים אחרים של עצות או המלצות שסופקו או מאושרים על ידי TradingView. קרא עוד בתנאים וההגבלות.
כתב ויתור
המידע והפרסומים אינם אמורים להיות, ואינם מהווים, עצות פיננסיות, השקעות, מסחר או סוגים אחרים של עצות או המלצות שסופקו או מאושרים על ידי TradingView. קרא עוד בתנאים וההגבלות.