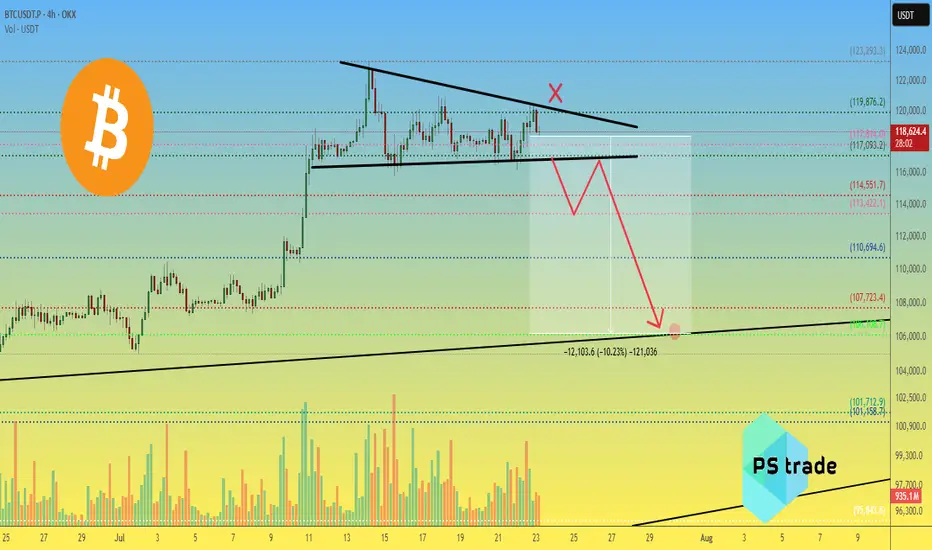
Price is being compressed under a descending trendline, and volume is steadily declining — a typical signal of an upcoming strong move.
📉 Downside target: $106,100 – $101,700
🔺 Invalidation: breakout above $119,876
📊 Key levels:
Resistance: $117000 / $113,500
Support: $110,694 / $107,723 / $106,108 / $101,712
⚠️ Pay attention — breakout is likely soon.
_____________________
Did you like our analysis? Leave a comment, like, and follow to get more
🎁 -20% for ALL trading fees at #OKX 👇
okx.com/join/20PSTRADE
🔥 V-I-P 👉 t.me/P_S_trade_menue_bot
🔵 Telegram 👉 t.me/pstrade_eng
🤖 Trading Bot 👉 copytrading.space/en/
📞 t.me/P_S_trades 📝
okx.com/join/20PSTRADE
🔥 V-I-P 👉 t.me/P_S_trade_menue_bot
🔵 Telegram 👉 t.me/pstrade_eng
🤖 Trading Bot 👉 copytrading.space/en/
📞 t.me/P_S_trades 📝
פרסומים קשורים
כתב ויתור
המידע והפרסומים אינם מיועדים להיות, ואינם מהווים, ייעוץ או המלצה פיננסית, השקעתית, מסחרית או מכל סוג אחר המסופקת או מאושרת על ידי TradingView. קרא עוד ב־תנאי השימוש.