BTC 8H chart - bullish fibonacci pullback zones for resersal
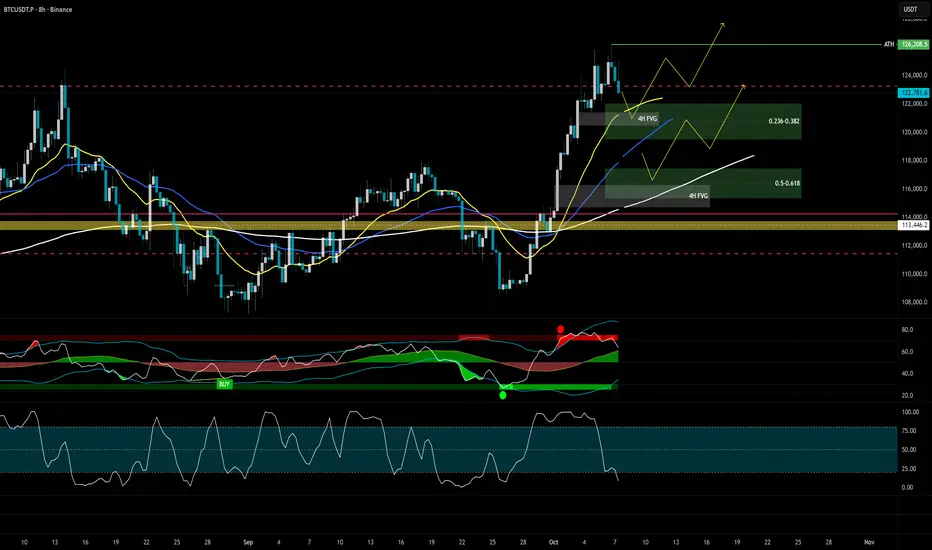
I have high probability two scenarios in mind approx. 4-8% pullback.
Notice lower oscillator indicator, Stoch RSI on 8H already starting to build momentum at the bottom zone.
Might take couple of days to consolidate in those levels.
Crypto grandpa sharing charts & setups. Free TA, zero fluff.
Not financial advice — still two feet above ground.
Follow me here and on Twitter X. Thanks!
Not financial advice — still two feet above ground.
Follow me here and on Twitter X. Thanks!
כתב ויתור
המידע והפרסומים אינם אמורים להיות, ואינם מהווים, עצות פיננסיות, השקעות, מסחר או סוגים אחרים של עצות או המלצות שסופקו או מאושרים על ידי TradingView. קרא עוד בתנאים וההגבלות.