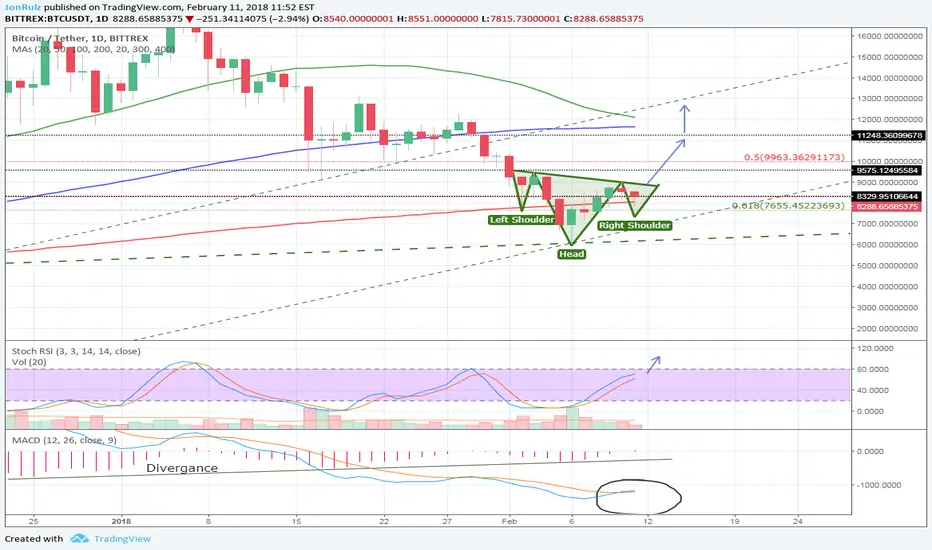
As we can see on the bitcoin -3.37% chart, a possible head and shoulder pattern could be at play. The MACD has crossed and there is a nice divergence I marked on the chart. These are bullish signs. However, yesterday ended on an indecisive candle stick. This means if BTC -3.37% ends on a red day, there could be some more red days. Right now it's to early to tell where BTC -3.37% will head short term. If it breaks this head and shoulder pattern and retests and stays above, I would consider that a good entry, if BTC -3.37% ends on a red day today, I would wait around for a bit.

הערה
Broke above neck line, a retest of the neckline will confirm further movement upward.הערה
Close to my 2nd target around $11,200הערה
$11,000 - $11,500 are good levels to take some profit. Sell your short term positions soon.עסקה סגורה: היעד הושג
It hit our target exactly. Another run could pop it to the red downtrend line, but I think that's less likely. I expect a pull back around 9.5k to 10k. Next target is between 12k - 12.5kפרסומים קשורים
כתב ויתור
המידע והפרסומים אינם אמורים להיות, ואינם מהווים, עצות פיננסיות, השקעות, מסחר או סוגים אחרים של עצות או המלצות שסופקו או מאושרים על ידי TradingView. קרא עוד בתנאים וההגבלות.
פרסומים קשורים
כתב ויתור
המידע והפרסומים אינם אמורים להיות, ואינם מהווים, עצות פיננסיות, השקעות, מסחר או סוגים אחרים של עצות או המלצות שסופקו או מאושרים על ידי TradingView. קרא עוד בתנאים וההגבלות.