~~ Technical Analysis ~~
-- Trend:
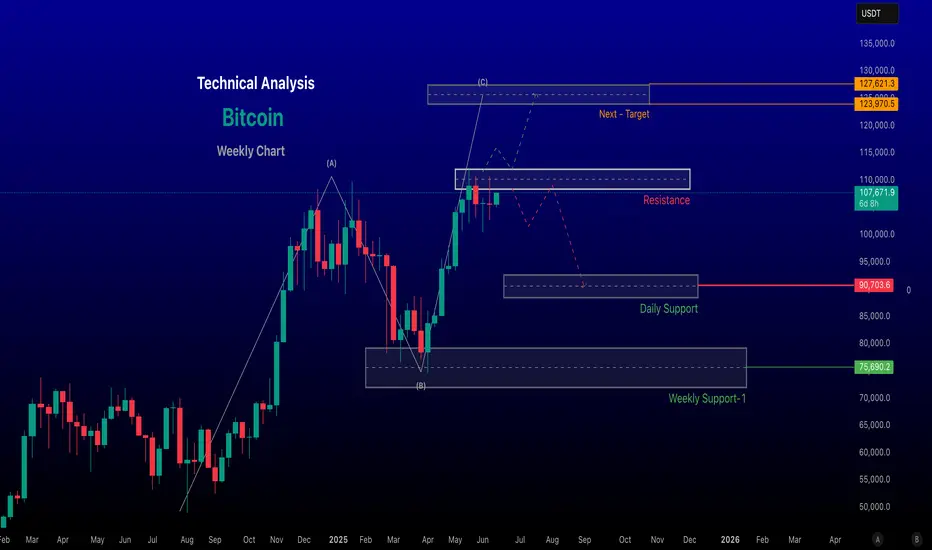
Short-Term: Bitcoin has broken the floor of a rising trend channel, suggesting a slower rise or potential sideways movement.
Medium/Long-Term: Despite the short-term slowdown, the long-term trend remains bullish, with Bitcoin testing resistance at ~$106,000–$110,000. A breakout above $111,000 could signal strong upward momentum.
Bearish Signals: Negative volume balance (higher volume on down days) and RSI divergence indicate potential for a short-term correction.
Key Levels:
Support: $102,400, $90,000
Resistance: $106,000–$110,000, with a critical zone at $110,000–$111,800. Breaking this could push BTC toward $125,000–$155,000.
-- Disclaimer --
This analysis is based on recent technical data and market sentiment from web sources. It is for informational purposes only and not financial advice. Trading involves high risks, and past performance does not guarantee future results. Always conduct your own research or consult a SEBI-registered advisor before trading.
#Boost and comment will be highly appreciated
-- Trend:
Short-Term: Bitcoin has broken the floor of a rising trend channel, suggesting a slower rise or potential sideways movement.
Medium/Long-Term: Despite the short-term slowdown, the long-term trend remains bullish, with Bitcoin testing resistance at ~$106,000–$110,000. A breakout above $111,000 could signal strong upward momentum.
Bearish Signals: Negative volume balance (higher volume on down days) and RSI divergence indicate potential for a short-term correction.
Key Levels:
Support: $102,400, $90,000
Resistance: $106,000–$110,000, with a critical zone at $110,000–$111,800. Breaking this could push BTC toward $125,000–$155,000.
-- Disclaimer --
This analysis is based on recent technical data and market sentiment from web sources. It is for informational purposes only and not financial advice. Trading involves high risks, and past performance does not guarantee future results. Always conduct your own research or consult a SEBI-registered advisor before trading.
#Boost and comment will be highly appreciated
renderwithme
כתב ויתור
המידע והפרסומים אינם אמורים להיות, ואינם מהווים, עצות פיננסיות, השקעות, מסחר או סוגים אחרים של עצות או המלצות שסופקו או מאושרים על ידי TradingView. קרא עוד בתנאים וההגבלות.
renderwithme
כתב ויתור
המידע והפרסומים אינם אמורים להיות, ואינם מהווים, עצות פיננסיות, השקעות, מסחר או סוגים אחרים של עצות או המלצות שסופקו או מאושרים על ידי TradingView. קרא עוד בתנאים וההגבלות.