🔹 Resistance Zone (📈💎)
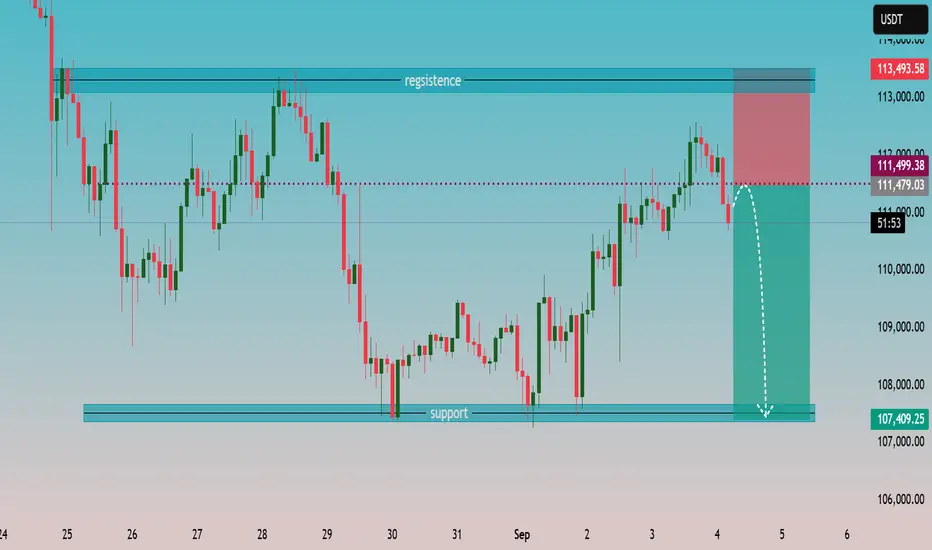
The chart highlights a robust resistance band around 113,000–113,500 USDT. Price has repeatedly failed to sustain above this ceiling, showing strong selling pressure at the top of the range.
🔹 Support Zone (🛡️📉)
Well-defined support sits near 107,000–107,500 USDT, where buyers previously defended the level multiple times, leading to rebounds.
🔹 Current Price Action (⚡🧐)
Recent rally tested resistance and was firmly rejected, forming a bearish engulfing structure on the latest candles.
The dotted red line at 111,499 USDT indicates the short entry trigger; projected target is toward the lower support zone.
Stop-loss marked just above resistance (~113,493 USDT) suggests a clear risk-to-reward framework.
🔹 Bearish Scenario (🚨🐻)
If downward momentum holds, price may follow the plotted white arrow toward the 107k region. A break below could open room for further weakness.
🔹 Bullish Contingency (🚀🐂)
Reclaiming and closing decisively above 113,500 USDT would invalidate the short setup, signaling renewed upward momentum.
📌 Summary (📝)
Market shows rejection at resistance with sellers gaining control. The risk-reward favors a short toward strong support near 107k, unless buyers retake the 113k+ zone.
עסקה פעילה
כתב ויתור
המידע והפרסומים אינם אמורים להיות, ואינם מהווים, עצות פיננסיות, השקעות, מסחר או סוגים אחרים של עצות או המלצות שסופקו או מאושרים על ידי TradingView. קרא עוד בתנאים וההגבלות.
כתב ויתור
המידע והפרסומים אינם אמורים להיות, ואינם מהווים, עצות פיננסיות, השקעות, מסחר או סוגים אחרים של עצות או המלצות שסופקו או מאושרים על ידי TradingView. קרא עוד בתנאים וההגבלות.