📉 BTCUSDT Elliott Wave Analysis – End of the Rally or Start of a Crash? ⚠️
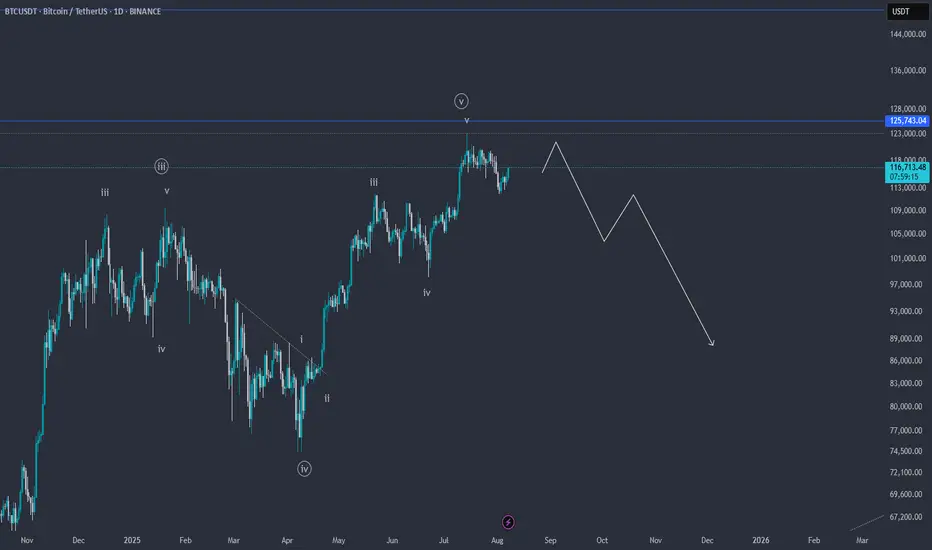
On the BTCUSDT chart, it appears that the fifth wave of the impulsive structure is nearing completion. The wave count clearly shows a full five-wave sequence, suggesting that Bitcoin may be forming a major top around the $119,000–$125,000 resistance zone.
🔻 If price action confirms a reversal and breaks key support levels, we could see a deep correction potentially taking BTC below $90,000.
📌 Keep in mind this is a scenario based on wave structure and requires confirmation via breakdowns and price action.
💬 What do you think? Is Bitcoin ready for a major correction, or will it break into new all-time highs?
✅ Save this idea & follow for updates!
כתב ויתור
המידע והפרסומים אינם אמורים להיות, ואינם מהווים, עצות פיננסיות, השקעות, מסחר או סוגים אחרים של עצות או המלצות שסופקו או מאושרים על ידי TradingView. קרא עוד בתנאים וההגבלות.
כתב ויתור
המידע והפרסומים אינם אמורים להיות, ואינם מהווים, עצות פיננסיות, השקעות, מסחר או סוגים אחרים של עצות או המלצות שסופקו או מאושרים על ידי TradingView. קרא עוד בתנאים וההגבלות.