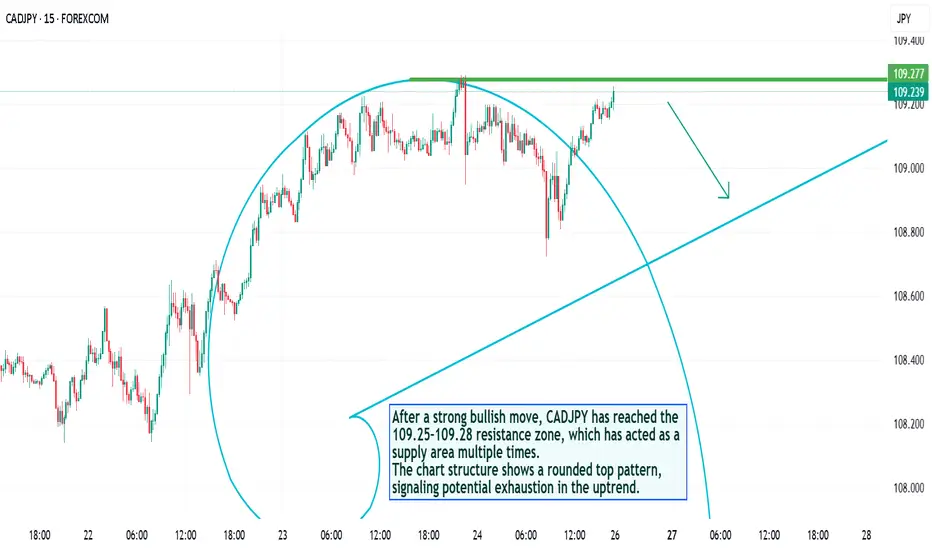
After a strong bullish move, CADJPY has reached the 109.25–109.28 resistance zone, which has acted as a supply area multiple times.
The chart structure shows a rounded top pattern, signaling potential exhaustion in the uptrend.
💡 Technical View:
Price repeatedly rejected from 109.27 zone.
Rounded top indicates weakening buying momentum.
A descending curve formation suggests upcoming bearish correction.
Rising trendline below (around 108.80–108.60) could be the next target zone.
📉 Trade Setup (Signal):
Entry (Sell): below 109.20
Stop Loss: 109.35
Take Profit 1: 108.90
Take Profit 2: 108.60
🧭 Bias: Short-term bearish
💬 Expecting price to turn down after testing resistance. If the pair breaks above 109.35 with volume, bearish view becomes invalid.
כתב ויתור
המידע והפרסומים אינם אמורים להיות, ואינם מהווים, עצות פיננסיות, השקעות, מסחר או סוגים אחרים של עצות או המלצות שסופקו או מאושרים על ידי TradingView. קרא עוד בתנאים וההגבלות.
כתב ויתור
המידע והפרסומים אינם אמורים להיות, ואינם מהווים, עצות פיננסיות, השקעות, מסחר או סוגים אחרים של עצות או המלצות שסופקו או מאושרים על ידי TradingView. קרא עוד בתנאים וההגבלות.