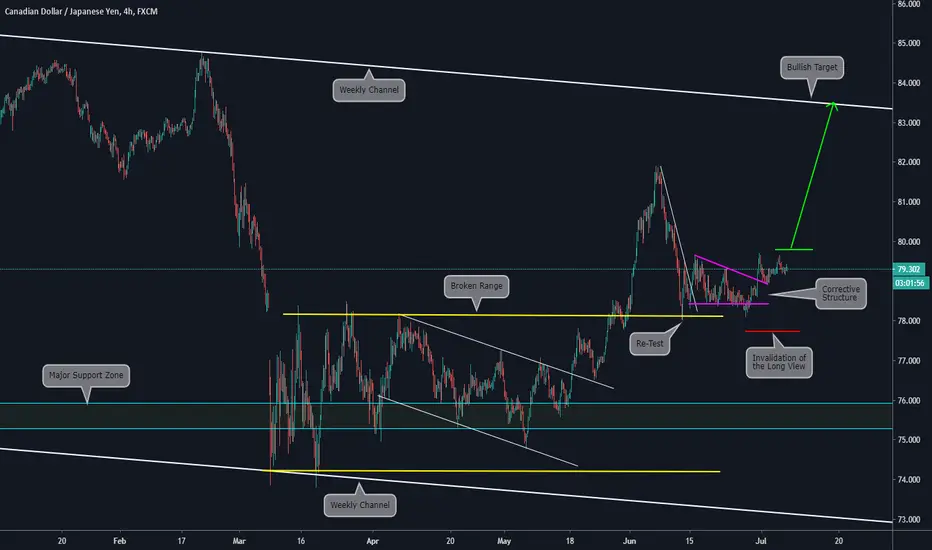
Main items we can see on the chart
a) The price has broken a range (yellow lines)
b) After the breakout, we saw a huge bullish movement and now we can see a retest of the zone
c) On the Zone, we saw a corrective structure (purple lines)
d) The corrective Structure has been broken
e) Based on that we expect that if the price goes above the green line, that will be a confirmation for the bullish movement to come
Daily Chart:
כתב ויתור
המידע והפרסומים אינם אמורים להיות, ואינם מהווים, עצות פיננסיות, השקעות, מסחר או סוגים אחרים של עצות או המלצות שסופקו או מאושרים על ידי TradingView. קרא עוד בתנאים וההגבלות.
כתב ויתור
המידע והפרסומים אינם אמורים להיות, ואינם מהווים, עצות פיננסיות, השקעות, מסחר או סוגים אחרים של עצות או המלצות שסופקו או מאושרים על ידי TradingView. קרא עוד בתנאים וההגבלות.