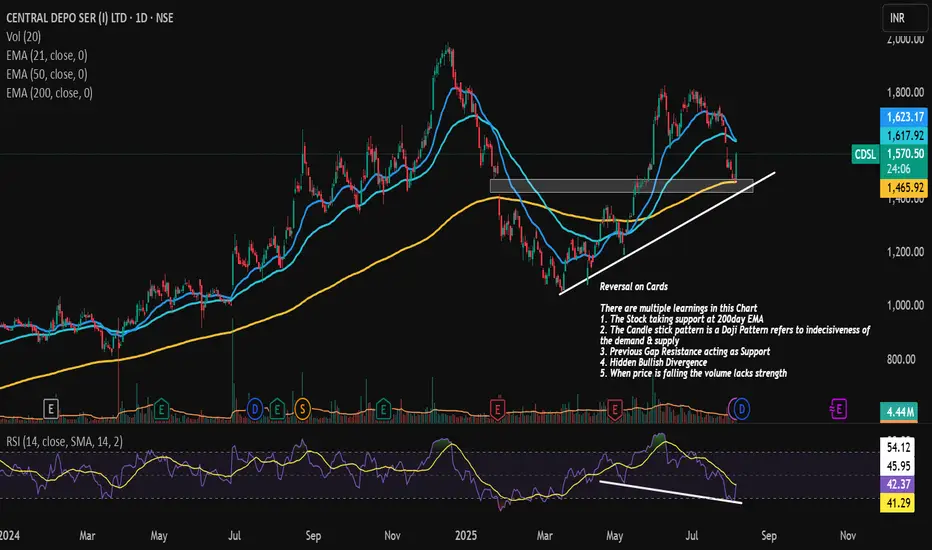
CDSL is on the verge or Reversal or Temporary Pull back
There are multiple learnings in this Chart
1. The Stock taking support at 200day EMA
2. The Candle stick pattern is a Doji Pattern refers to indecisiveness of the demand & supply
3. Previous Gap Resistance acting as Support
4. Hidden Bullish Divergence
5. When price is falling the volume lacks strength
פרסומים קשורים
כתב ויתור
המידע והפרסומים אינם מיועדים להיות, ואינם מהווים, ייעוץ או המלצה פיננסית, השקעתית, מסחרית או מכל סוג אחר המסופקת או מאושרת על ידי TradingView. קרא עוד ב־תנאי השימוש.
פרסומים קשורים
כתב ויתור
המידע והפרסומים אינם מיועדים להיות, ואינם מהווים, ייעוץ או המלצה פיננסית, השקעתית, מסחרית או מכל סוג אחר המסופקת או מאושרת על ידי TradingView. קרא עוד ב־תנאי השימוש.