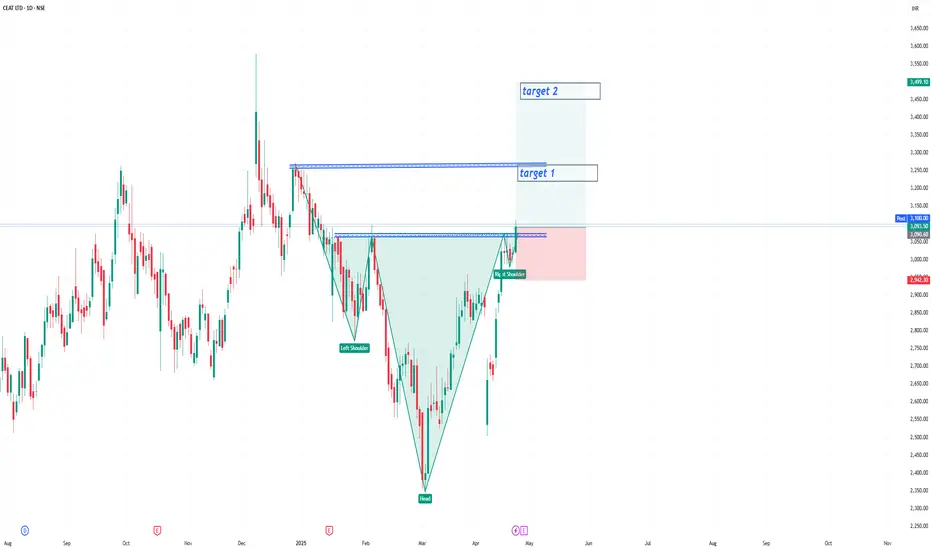
CEAT Ltd has formed a classic Cup & Handle pattern on the daily chart, indicating a strong bullish continuation setup.
Breakout supported by increasing volume
Retest zone: 3,000 – 3,050 (Good entry opportunity)
SL: 2,870 (below handle support)
📈 Targets:
T1: 3,300
T2: 3,500
T3: 3,900 (measured move target)
💡 Bias: Bullish continuation | Swing to Positional
🕒 Timeframe: Daily Chart
Breakout supported by increasing volume
Retest zone: 3,000 – 3,050 (Good entry opportunity)
SL: 2,870 (below handle support)
📈 Targets:
T1: 3,300
T2: 3,500
T3: 3,900 (measured move target)
💡 Bias: Bullish continuation | Swing to Positional
🕒 Timeframe: Daily Chart
כתב ויתור
המידע והפרסומים אינם אמורים להיות, ואינם מהווים, עצות פיננסיות, השקעות, מסחר או סוגים אחרים של עצות או המלצות שסופקו או מאושרים על ידי TradingView. קרא עוד בתנאים וההגבלות.
כתב ויתור
המידע והפרסומים אינם אמורים להיות, ואינם מהווים, עצות פיננסיות, השקעות, מסחר או סוגים אחרים של עצות או המלצות שסופקו או מאושרים על ידי TradingView. קרא עוד בתנאים וההגבלות.