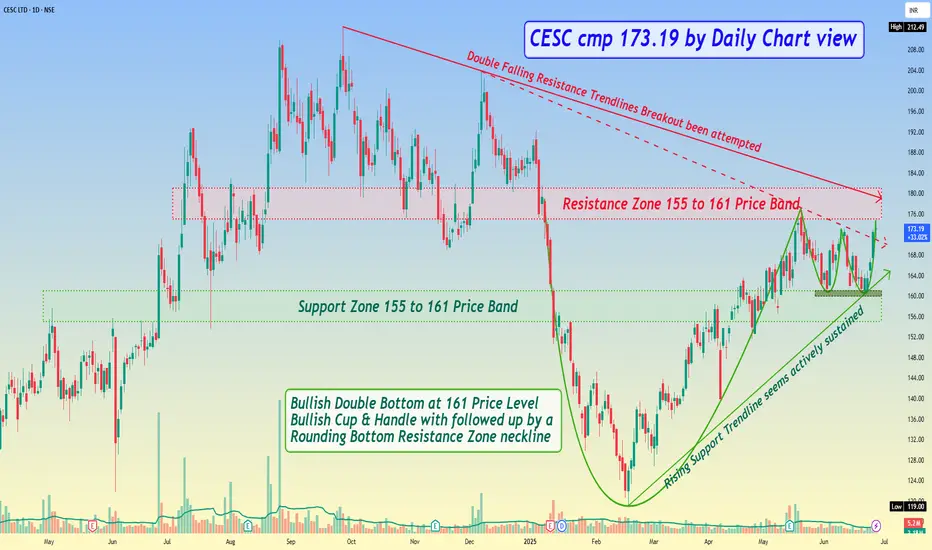
*CESC cmp 173.19 by Daily Chart view*
- Support Zone 155 to 161 Price Band
- Resistance Zone 155 to 161 Price Band
- Bullish Double Bottom at 161 Price Level
- Rising Support Trendline seems actively sustained
- Volumes spiking seen in sync with the avg traded quantity
- Double Falling Resistance Trendlines Breakout been attempted
- Bullish Cup & Handle with followed up by a Rounding Bottom Resistance Zone neckline
פרסומים קשורים
כתב ויתור
המידע והפרסומים אינם מיועדים להיות, ואינם מהווים, ייעוץ או המלצה פיננסית, השקעתית, מסחרית או מכל סוג אחר המסופקת או מאושרת על ידי TradingView. קרא עוד ב־תנאי השימוש.
פרסומים קשורים
כתב ויתור
המידע והפרסומים אינם מיועדים להיות, ואינם מהווים, ייעוץ או המלצה פיננסית, השקעתית, מסחרית או מכל סוג אחר המסופקת או מאושרת על ידי TradingView. קרא עוד ב־תנאי השימוש.