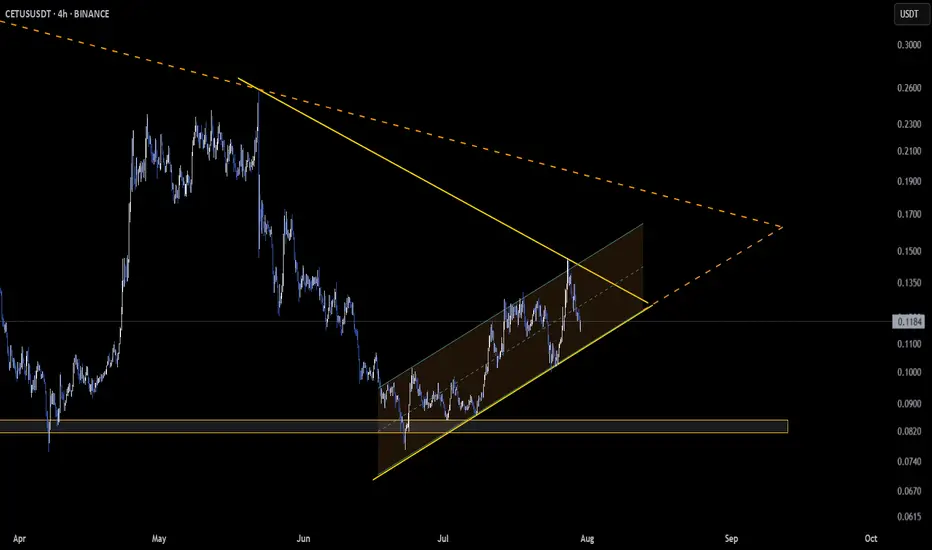
🔍 $CETUS is compressing tightly on the daily chart—coiling inside a symmetrical triangle 📐 while staying within the bounds of an ascending channel 📈. This layered structure signals growing pressure beneath the surface.
A sharp rejection from the upper trendline ❌ has shifted attention back to the lower support zone. Will it rebound from here or crack below?
⚠️ This is a high-stakes area to watch—momentum is building, and a breakout in either direction could trigger a major move.
Drop your bias below—bullish continuation or bearish snap?
Not financial advice.
I share more in my court
Join me on X: x.com/Coin_Mastermind
Join me on Telegram: t.me/coin_mastermind
Join me on X: x.com/Coin_Mastermind
Join me on Telegram: t.me/coin_mastermind
כתב ויתור
המידע והפרסומים אינם אמורים להיות, ואינם מהווים, עצות פיננסיות, השקעות, מסחר או סוגים אחרים של עצות או המלצות שסופקו או מאושרים על ידי TradingView. קרא עוד בתנאים וההגבלות.